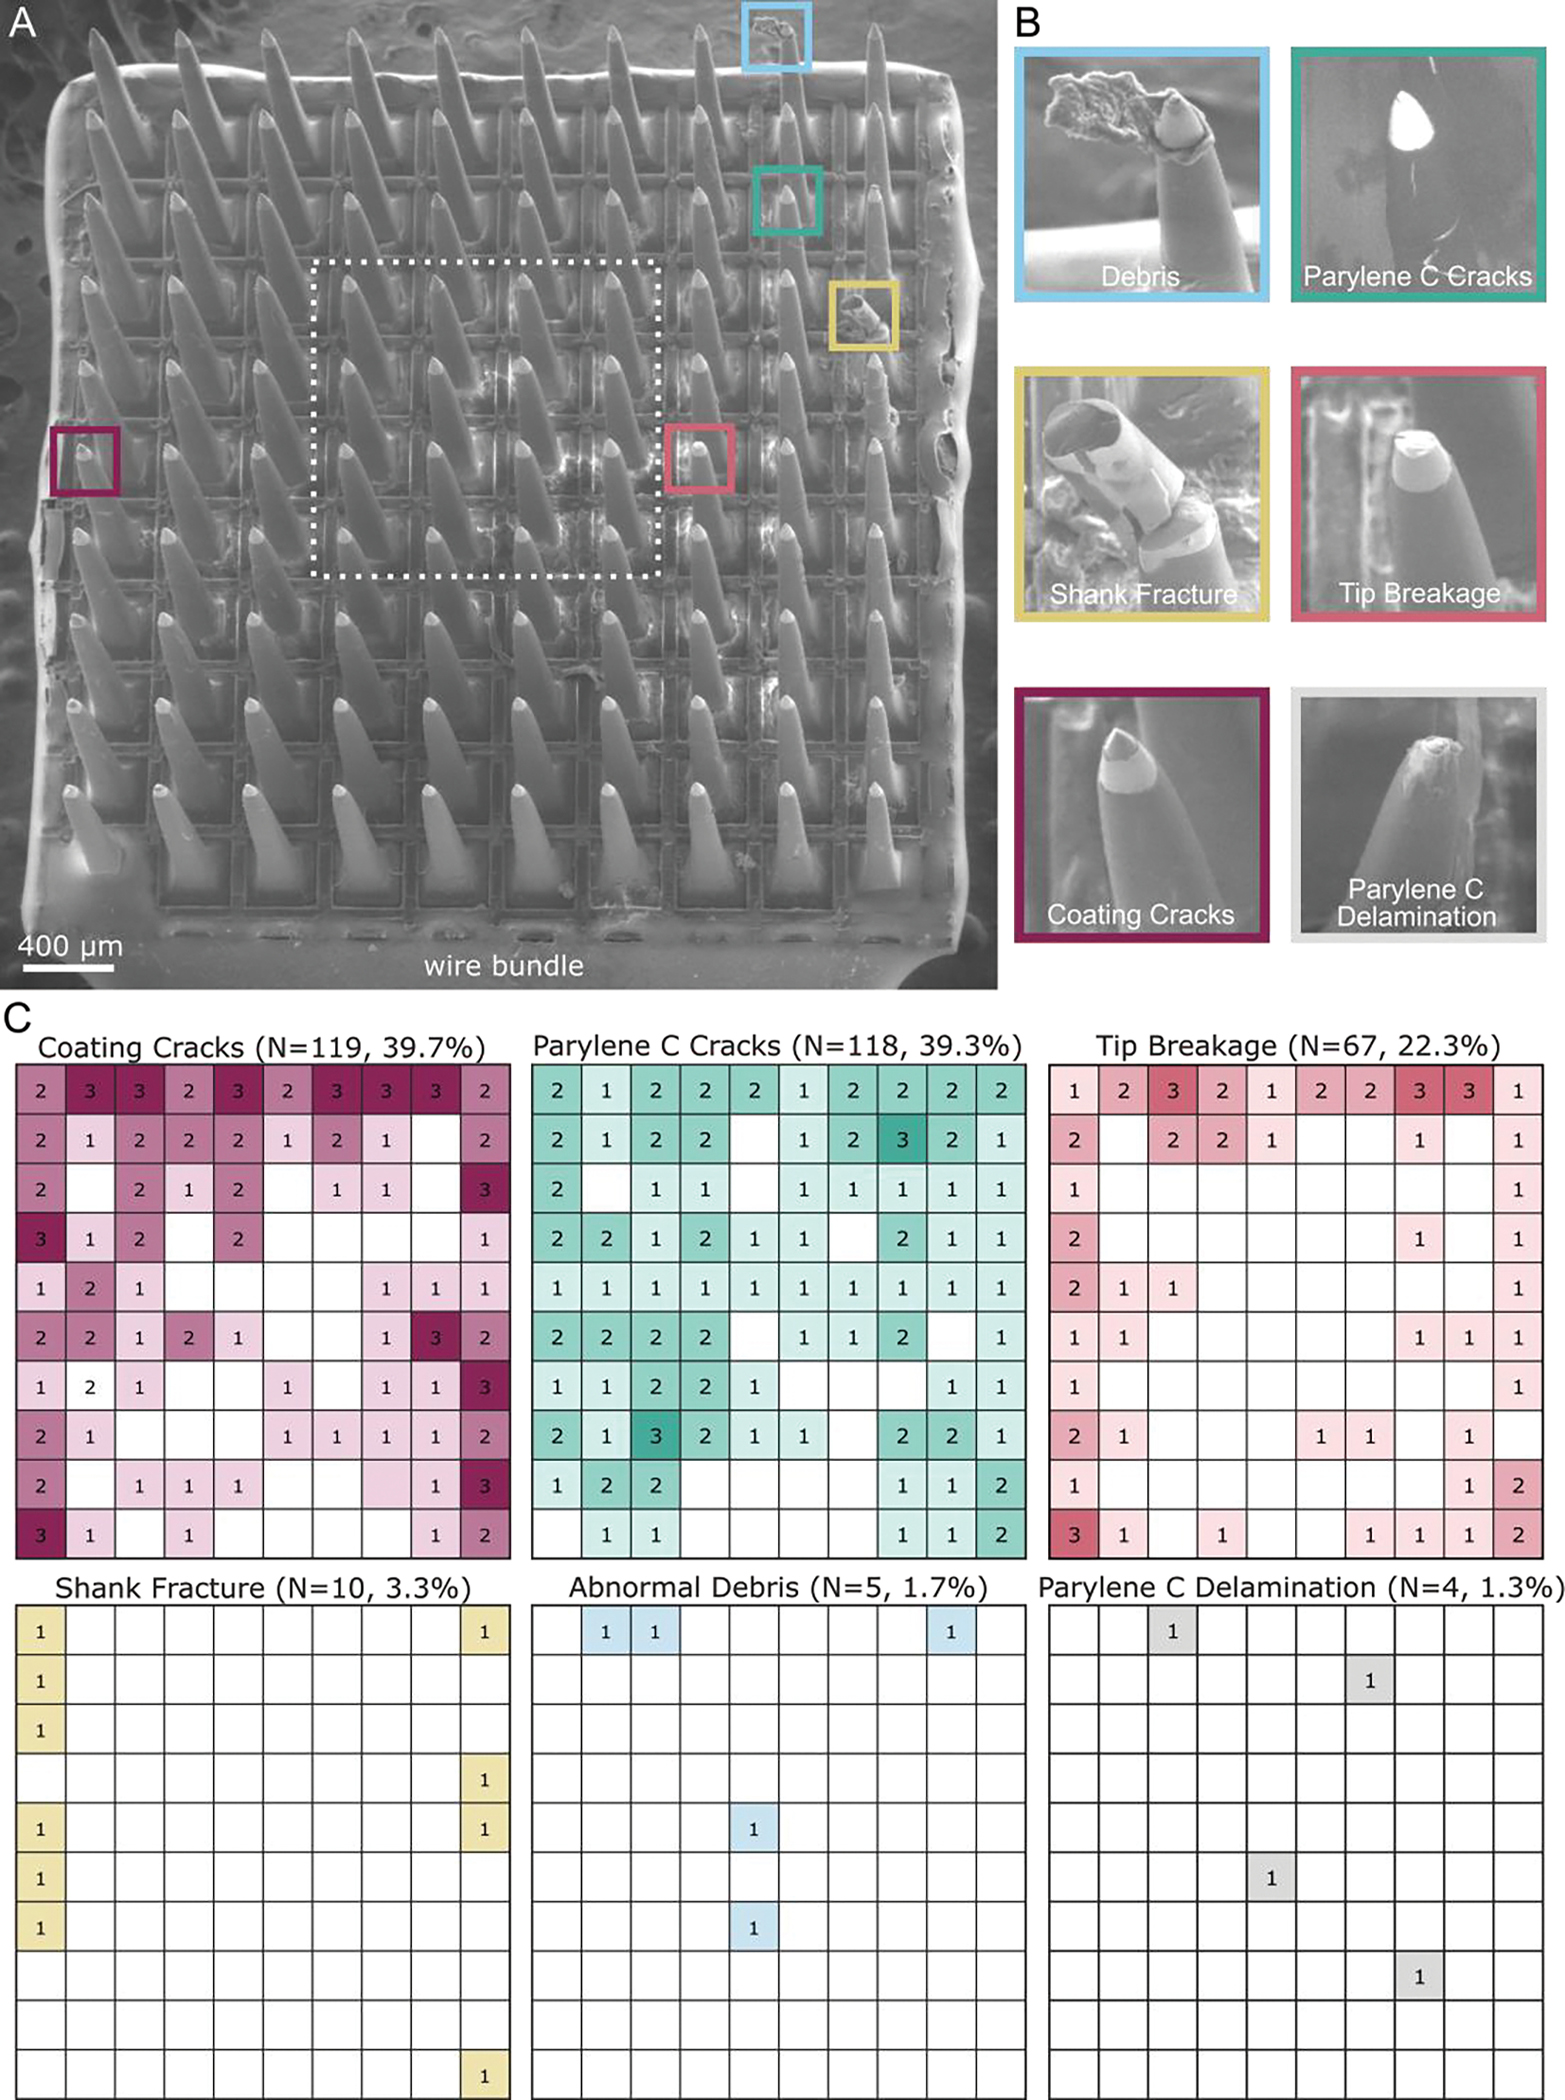
Figure 3.

Explanted UEA SEM images and analysis for degradation. A) SEM image of the UEA implanted in the left sensory cortex after 848 days. The UEA is oriented with the wire bundle on the bottom edge. B) Example images of the six categories quantified across three analyzed UEAs. Images of debris, Parylene C cracks, shank fracture, tip breakage, and coating cracks are from the UEA in the left sensory cortex in (A). The representative image of Parylene C delamination is from the UEA in the right motor cortex, as the UEA in the left sensory cortex did not exhibit Parylene C delamination. C) Heat maps of the summation of categorical occurrences in the three analyzed UEAs. The orientation of each heat map is that of the image in (A). Coating cracks occurred most frequently (N=119 electrode shanks, 39.7%), followed by Parylene C cracks (N=118, 39.3%), and then tip breakage (N=67, 22.3%). Coating cracks and tip breakage were significantly more frequent in the outer three rows of electrode shanks than the inner four rows (p-value < 0.05). Shank fracture (N=10, 3.3%), abnormal debris (N=5, 1.7%), and Parylene C delamination (N=4, 1.3%) occurred less frequently.
