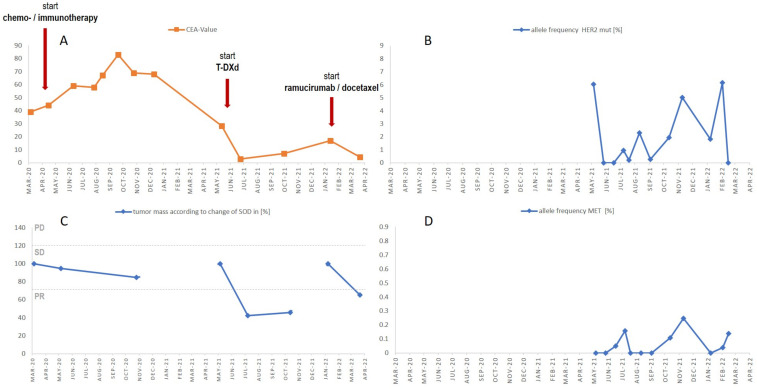
Figure 2.
CEA levels and change in SOD according to RECIST during 1st-, 2nd- and 3rd-line therapy. In addition, allele frequencies of HER2 and MET mutations are shown during treatment with T-DXd. (A) CEA values, (B) HER2 p.G776delinsVC allele frequency, (C) RECIST 1.1 criteria, change of sum of diameters as % of tumor mass. PD progressive disease, SD stable disease and PR partial response. (D) MET p.H1112Y allele frequency. Red arrows indicate change in therapy.

