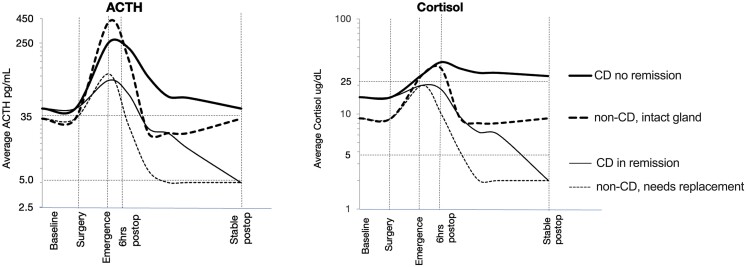
Figure 6.
Conceptual representation of perioperative ACTH and cortisol dynamics in CD (solid lines) and non-CD (dashed lines) patients plotted on a log10 scale. ACTH peak at extubation (approximately 400 pg/mL) distinguishes an intact pituitary gland (thick dashed line) from damaged gland (thin dashed line) and suppressed gland in CD (solid lines). A delayed cortisol peak similarly distinguishes CD patients in remission (thin solid line) from nonremission (thick solid line). Abbreviations: CD, Cushing's disease.

