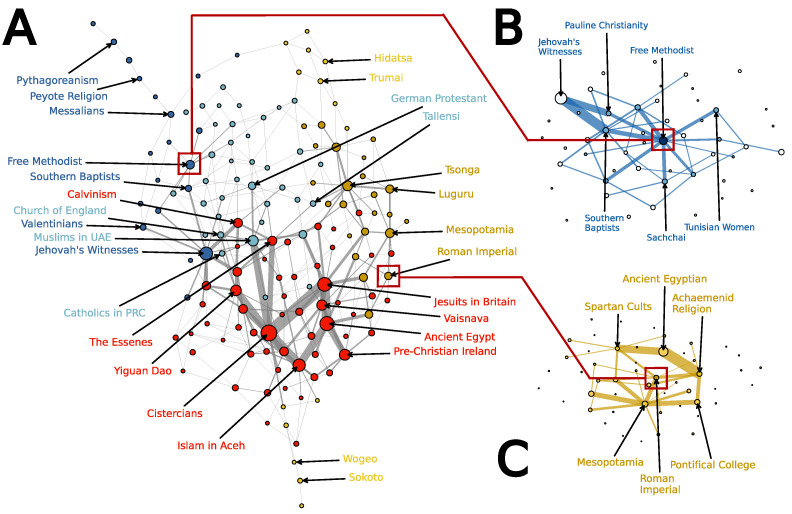
Figure 4.
(A) (left) shows the 150 configurations that have the highest probability mass according to our model. We only show edges between configurations (nodes) that are immediate neighbors (separated by 1 Hamming distance). Nodes are scaled by the probability mass assigned to each configuration, and edges are scaled by the product of the probability mass of the nodes that they connect. Colors are assigned to each of five groups based on hierarchical clustering (see Appendix A.2 and the dendrogram, Figure A1). (B) shows the 50 most probable configurations in the local neighborhood of the Free Methodist Church, while (C) shows the 50 most probable configurations in the local neighborhood of the Roman Imperial Cult. In all cases (A–C), the layout is determined by a force-directed placement algorithm [34] as implemented in Graphviz [35]. For more on the layout approach, see Appendix A.1.

