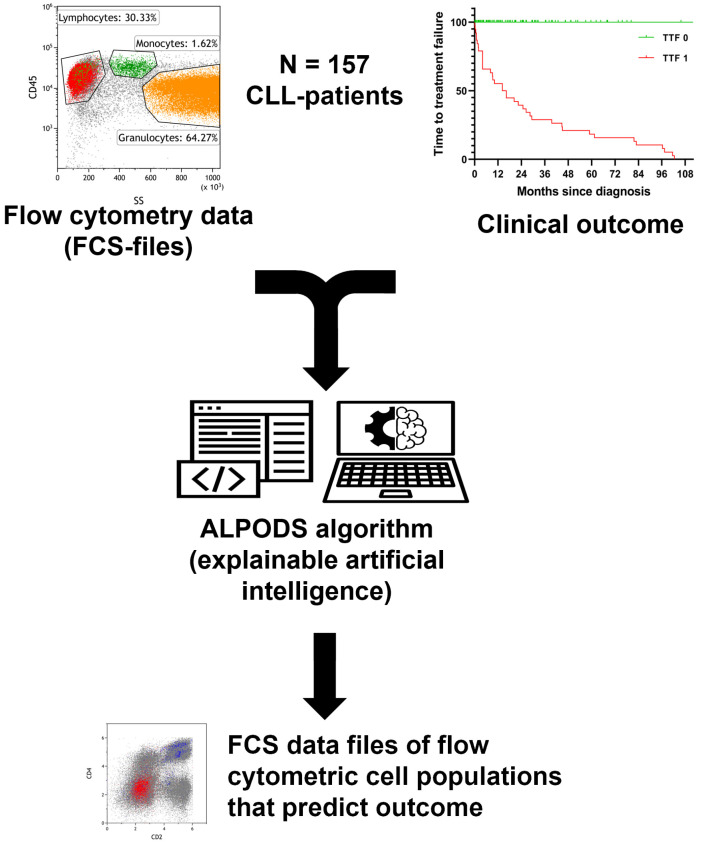
Figure 1.
Workflow and data processing. Flow cytometry raw data was standardized and assigned to the outcome group (TTF 1 inferior, TTF 0 superior). The ALPODS algorithm was used to identify distinctive cell populations with different frequencies in TTF 1 versus TTF 0 The most important populations for determination were visualized in flow cytometry bivariate dot plots and assigned to their biological counterparts.

