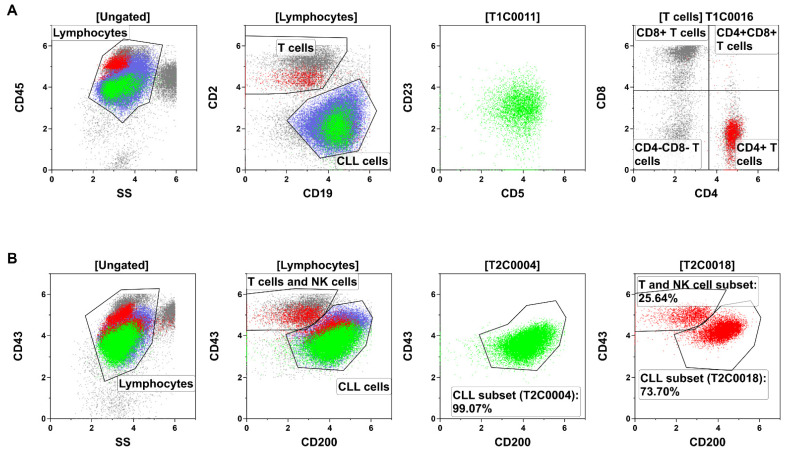
Figure 3.
Identification and description of the XAI population through flow cytometry gating in a representative sample. (A) The populations T1C0011 (green) and T1C0016 (red) were the most relevant populations for the outcome and prognosis in Tube 1 (T1) of the analyzed B-cell panel. T1C0011 (green) could be located within the CLL cells (blue). The population of T1C0016 (red) corresponded to CD4+ T cells (i.e., T helper cells). (B) T2C0004 (green) and T2C0018 (red) were the most relevant populations for the outcome and prognosis in Tube 2 (T2). Both were located mainly within the CLL cells (blue), but T2C0018 was a mixture of a biologically different population (CLL cells and T/NK cells).

