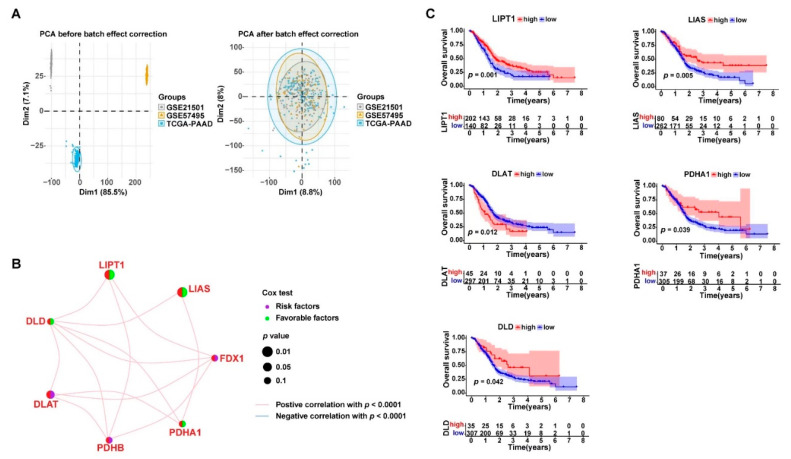
Figure 2.
Cuproptosis-related gene expression was closely associated with the prognosis of PDAC. (A) Three transcriptome sequencing datasets, TCGA-PAAD (n = 177), GSE21501 (n = 132), and GSE57495 (n = 63), were combined for further analysis (n = 372) after removing the batch effects using the “limma” and “sva” R packages; the left PCA plot shows the large dispersion difference among the samples from the three datasets before removing the batch effects; the right PCA plot shows that the samples were successfully clustered together after the batch effect correction; PCA: principal component analysis. (B) Network plot displaying the expression correlations between the genes; the association between the gene expression and PDAC prognosis is annotated by dots in different colors according to the univariate Cox regression analysis. (C) Kaplan–Meier survival curves showing the association between the gene expression levels and PDAC prognosis.

