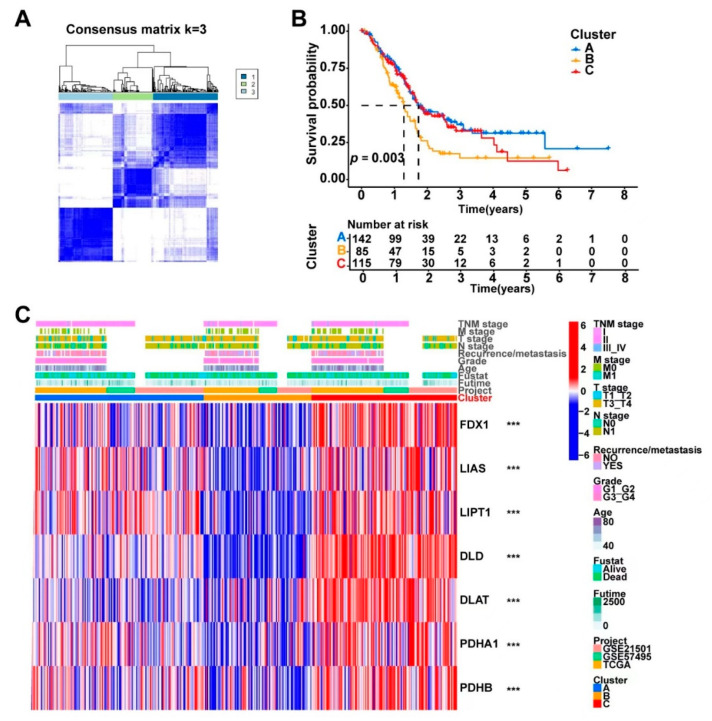
Figure 3.
The combined 372 PDAC samples were divided into three main clusters using the consensus clustering method based on the expression levels of the cuproptosis-related genes. (A) Consensus matrix of the optimal cluster number (k = 3). (B) Kaplan–Meier survival analysis comparing the patients’ prognosis between the three clusters (Clusters A, B, and C). (C) Heatmap displaying the distribution of the clinicopathologic features and gene expression levels of each sample in the three clusters; the expression levels of the cuproptosis-related genes were compared between the three clusters; *** p < 0.001. A PCA analysis based on transcriptome data showed that the three identified clusters had distinct differential gene expression patterns (Figure 4A). To better understand the functional differences between the three clusters, we performed a differential gene expression analyses using the “limma” R package. A number of DEGs (logFC > 0.5 and FDR < 0.05) were identified between Clusters A, B, and C (Supplementary Figure S5A). A combination of these DEGs was then generated and found to contain a total of 686 protein-coding genes. The potential biological functions of these 686 DEGs generated by comparing the different cuproptosis-related clusters were further explored via a GO (Supplementary Figure S5B) and KEGG (Figure 4B,C) pathway enrichment analysis. The 686 DEGs were significantly enriched in several classical cancer-related pathways, such as the “PI3K-Akt signaling pathway”, “PPAR signaling pathway”, “EMC-receptor”, and “Proteoglycans in cancer”, which indicated that cuproptosis was associated with cancer development in PDAC.

