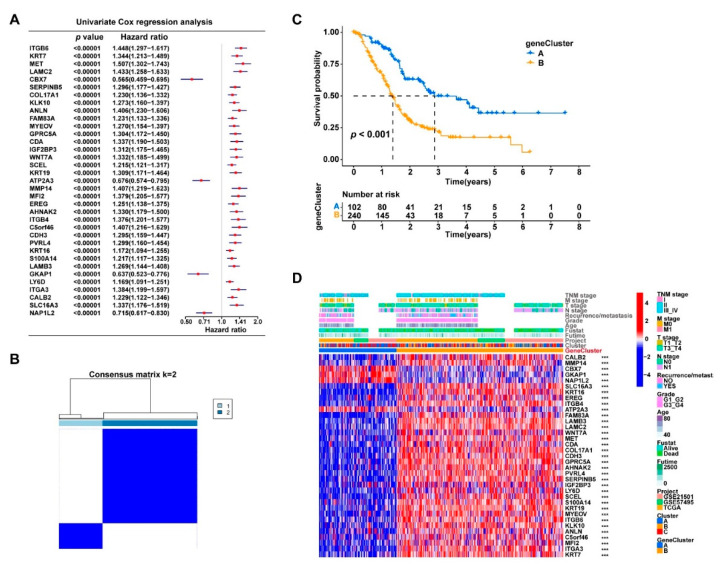
Figure 5.
The prognosis-related DEGs from the three cuproptosis-related clusters could further divide the PDAC samples into two subgroups with significant survival difference. (A) The univariate Cox regression analysis identified 35 DEGs that were the most significant prognostic factors (p < 0.00001) for PDAC patients; the p-values and hazard ratios with 95% confidence intervals are presented in the forest plot.(B) The 372 PDAC samples were clustered into two subtypes (geneClusters A and B) based on the 35 gene expression levels using the consensus clustering algorithm; the optimal k value was 2. (C) Kaplan–Meier survival curves comparing the patients’ survival between geneClusters A and B. (D) Heatmap displaying the distribution of the clinicopathologic features and gene expression levels of each sample in geneClusters A and B; gene expression levels of the cuproptosis-related genes were compared between the three clusters; *** p < 0.001.

