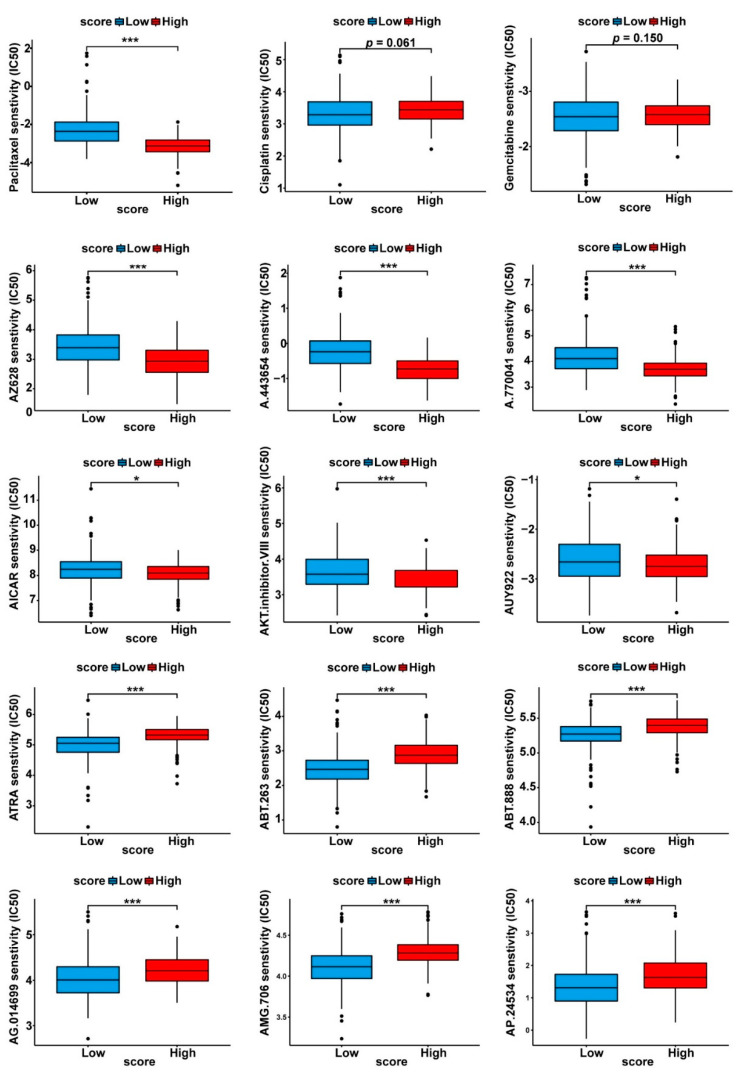
Figure 7.
Prediction of the chemotherapeutic response between the subgroups with high and low PC scores. The phenotype of the chemotherapeutic response for each sample was predicted from the gene expression data using the “pRRophetic” R package; the drug sensitivity (IC50) values were calculated, and the drugs with the most significant response differences between the two subgroups are shown in the box plots; drugs with significantly lower IC50 values were considered to be sensitive for PDAC treatment. * p < 0.05, *** p < 0.001.

