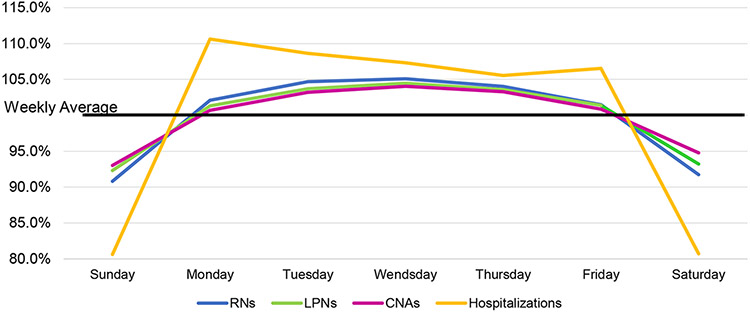
Figure 1: Staffing per Resident-Day and Hospitalizations by Day of the Week as Percent of the Weekly Average*.
Note: The weekly average is calculated separately for each of the 4 variables depicted in the chart.
The Y scale shows how the value of the variable on any given day deviates from the weekly average for that variable.
Example: On Sunday, hospitalizations are 81% of the hospitalization weekly average, RNs are at 91% of the RN weekly average, LPNs are at 95.5% of the LPN weekly average, and CNAs are at 96% of the CNA weekly average.

