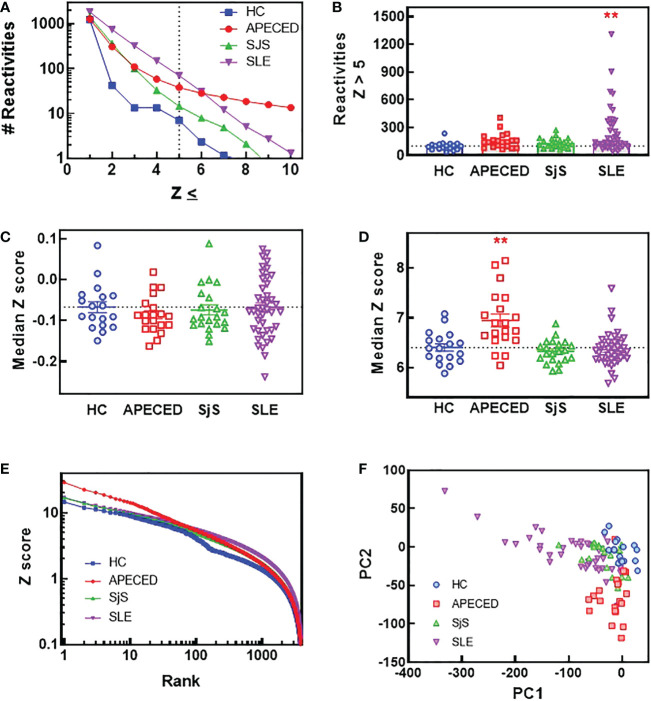
Figure 1.
ProtoArray analysis of autoimmune patients reveals that autoantibody repertoires differ in the number of reactivities and their clonality between diseases. Plasma samples from patients and HCs were tested using the human ProtoArray covering 9483 proteins for IgG reactivity. Z scores were calculated to quantify reactivity for patients versus the HC group. (A) The median number of reactivities above a Z score threshold ranging from 1 to 10 were plotted for each group. (B) The number of reactivities with a median Z score >5 are plotted for each group. (C) The median Z score is plotted for each subject and also (D) for only reactivities with a Z score >5. (E) The top 4000 reactivities for each group are plotted ranked by highest Z score with the Z score for each reactivity on the Y axis. (F) A PCA plot was constructed of all subjects based on the ProtoArray data. (**significantly different from HC ANOVA p<0.01). HCs, healthy controls; IgG, immunoglobulin G; PCA, principal component analysis.

