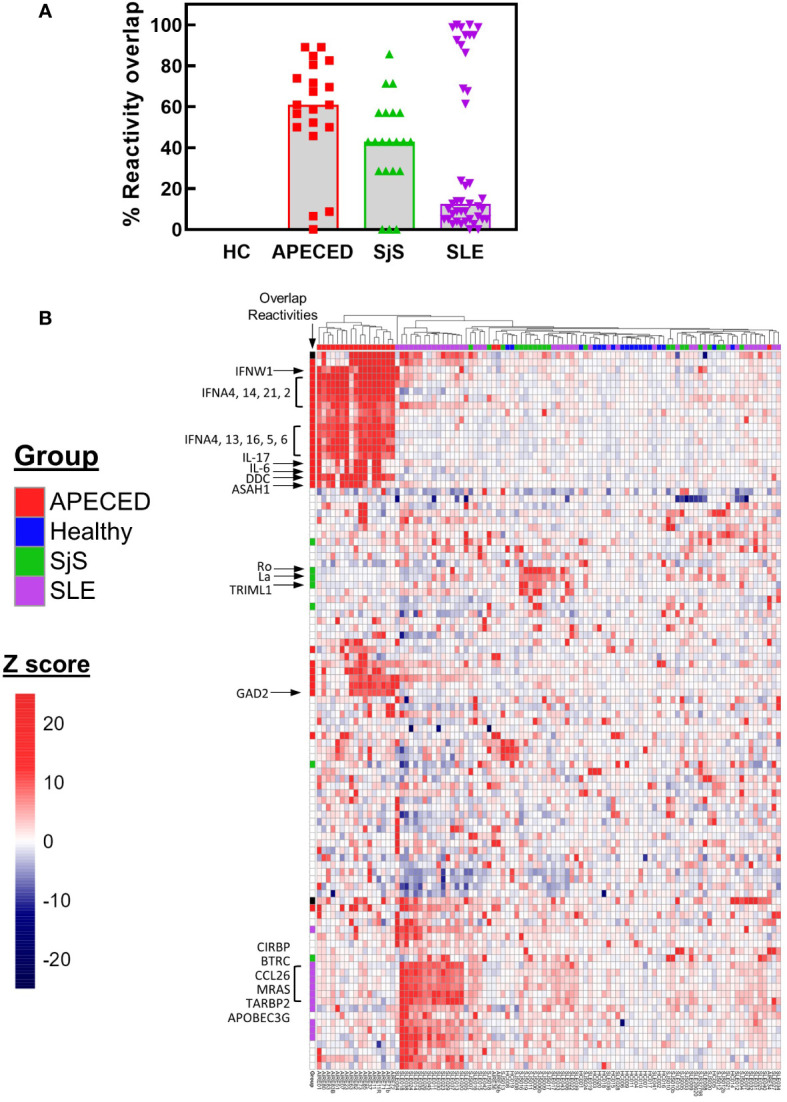
Figure 3.

ProtoArray analysis of autoimmune patients reveals that autoantibody repertoires differ in the number of reactivities within and between groups. (A) The amount of overlap in the ProtoArray reactivity for each subject with other subjects in each group is shown. Overlap was considered for common reactivities with a Z >5 in 30% of the subjects for each group. (B) The highest 100 reactivities by variance are presented in a hierarchal clustered heat map. The heat map is colored by Z score and each column represents an individual subject with the group identified by the color bar above the column. Several key canonical reactivities are identified with arrows. Markings in the column labeled ‘Overlap’ identify which reactivities had a high degree of overlap for each group (Z >5 in 30% of the subjects for each group). APECED, autoimmune polyendocrinopathy–candidiasis–ecto-dermal dystrophy; HC, healthy control; SLE, systemic lupus erythematosus; SjS, Sjogren’s syndrome.
