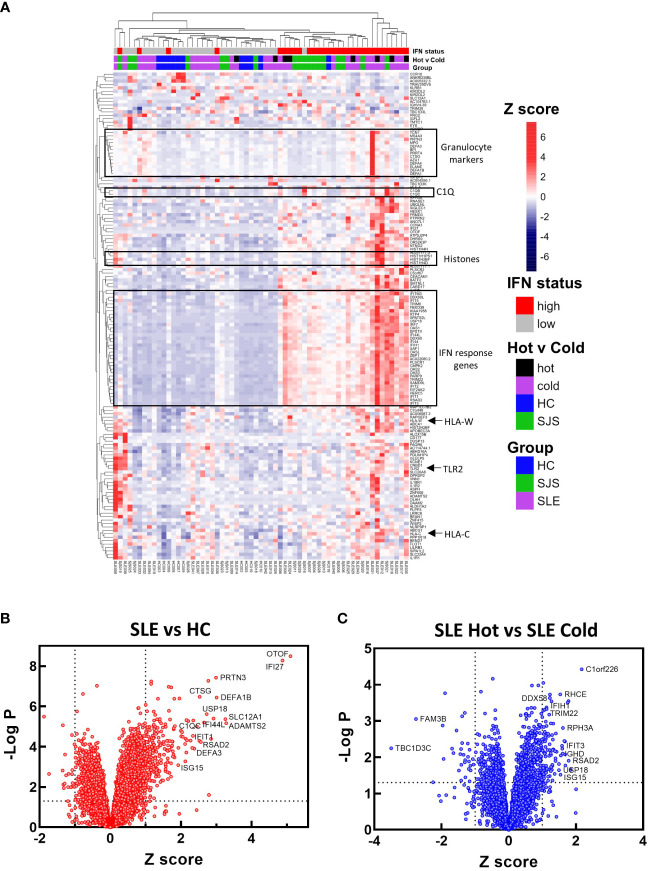
Figure 5.
RNA-seq gene expression analysis. RNA-seq gene expression analysis was performed on blood samples from HCs, SjS, and SLE subjects. (A) Gene expression data is presented in a heat map as normalized expression to show comparisons for SLE versus HC or SLE ‘cold’ versus SLE ‘hot’. (B, C) Volcano plots were constructed for differential expression comparisons and dotted lines show a Z score cutoff of 0.7 and a p value cutoff of 0.01 and notable gene changes are labeled. HCs, healthy controls; SLE, systemic lupus erythematosus; SjS, Sjogren’s syndrome.

