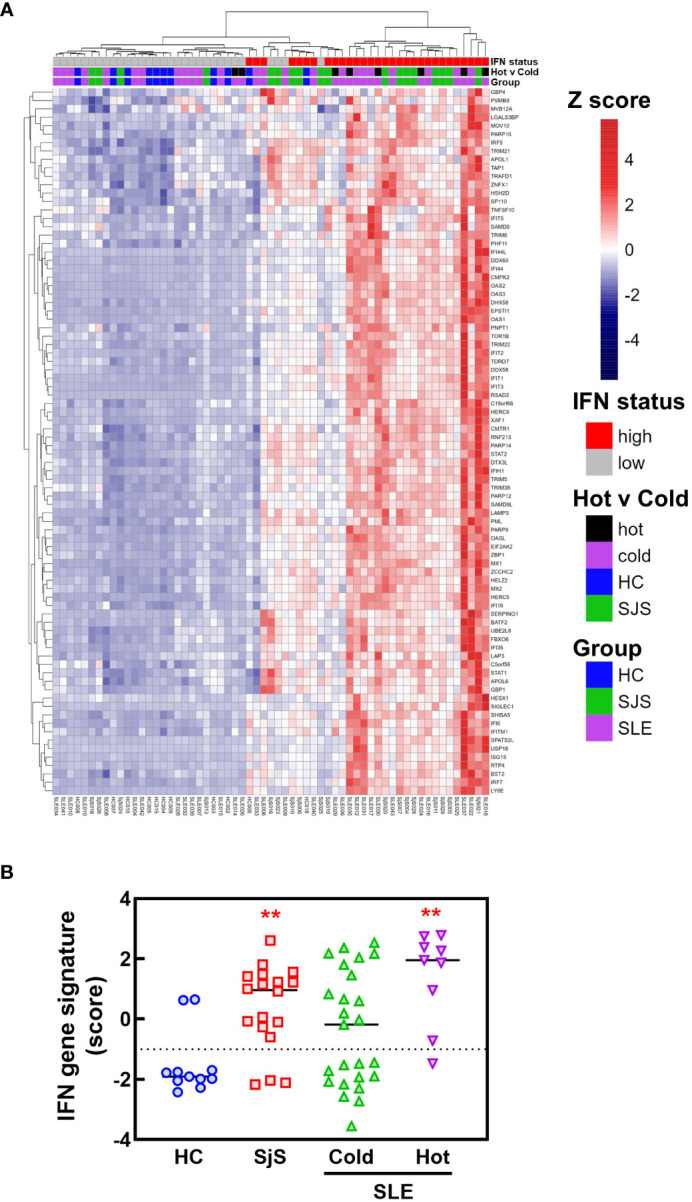
Figure 6.

RNA-seq analysis of IFN response gene expression in SLE and SjS patients. RNA-seq analysis was performed on blood samples collected from HCs, SLE, and SjS subjects. (A) Z scores were calculated and a heat map was constructed to show the relative expression of 84 ImSig IFN pathway genes. (B) IFN gene signature scores were calculated using a panel of 9 IFN-regulated genes with the score for each subject represented by a different symbol and lines show the group medians. (**significantly different from HC ANOVA p<0.01). HCs, healthy controls; ImSig, immune cell type-specific gene expression signatures; SLE, systemic lupus erythematosus; SjS, Sjogren’s syndrome.
