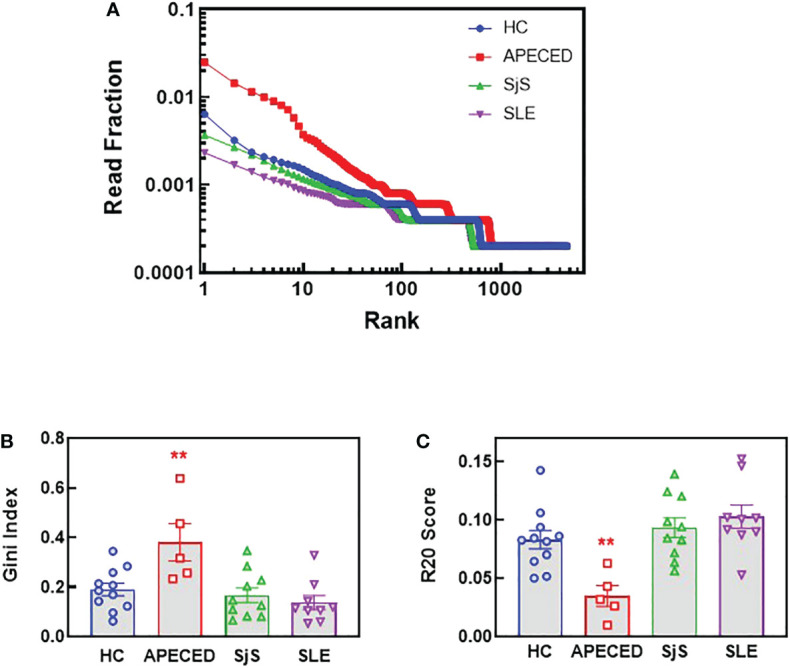
Figure 7.

NGS BCR repertoire analysis of the sequence diversity and clonality of different disease groups. Switched memory B-cells were isolated from peripheral blood and RNA was purified for BCR sequencing. (A) The fraction of all reads for each clonotype were plotted with the clonotypes ranked from most abundant to least abundant for the top 4000 clonotypes. (B) The Gini score was calculated based on the clonotype frequency for each patient and the results are plotted by groups. (C) Clonality was determined for each subject and the R20 values for each subject are presented by group as the fraction of unique clones representing 20% of the sequenced repertoire, so the higher the R20 the less clonal dominance. (**significantly different from HC ANOVA p<0.01). APECED, autoimmune polyendocrinopathy–candidiasis–ecto-dermal dystrophy; BCR, B-cell receptor; HC, healthy control; NGS, next-generation sequencing; SLE, systemic lupus erythematosus; SjS, Sjogren’s syndrome.
