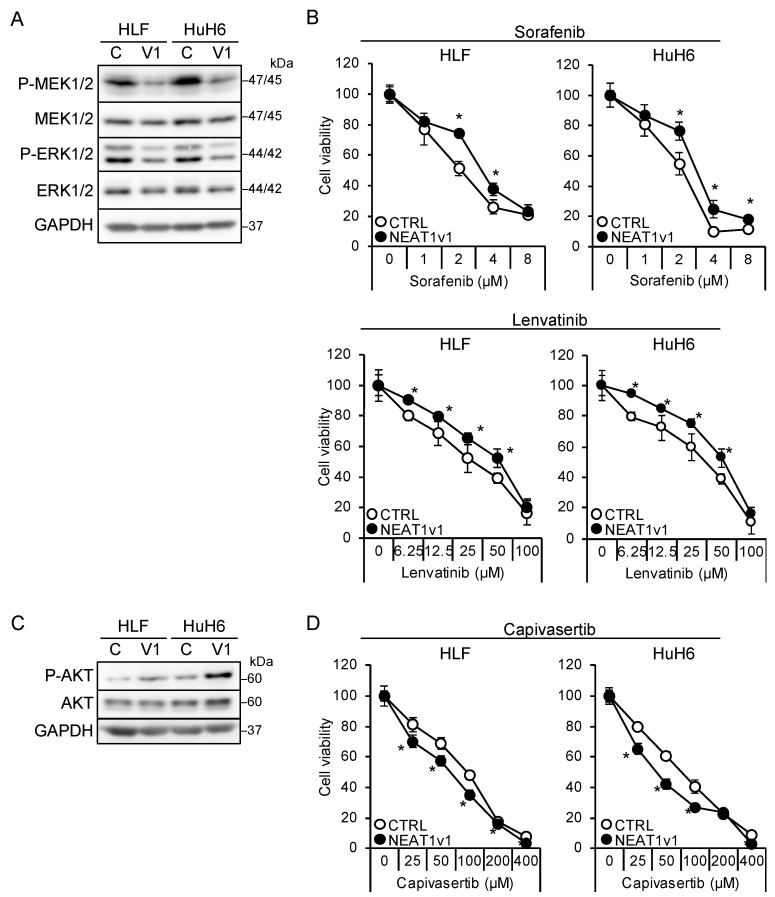
Figure 3.
NEAT1v1 plays a role as a molecular switch of cell growth modality. (A,C) Representative Western blot images for the indicated proteins in control (C) or NEAT1v1-overexpressing (V1) cells. GAPDH is shown as an internal control. (B,D) Viabilities of control (CTRL) or NEAT1v1-overexpressing (NEAT1v1) cells treated with sorafenib (B), lenvatinib (B), or capivasertib (D) at the concentrations indicated in the figure for 48 h relative to cells treated with DMSO (100%). * p < 0.05 vs. CTRL (Student’s t-test; n = 4).

