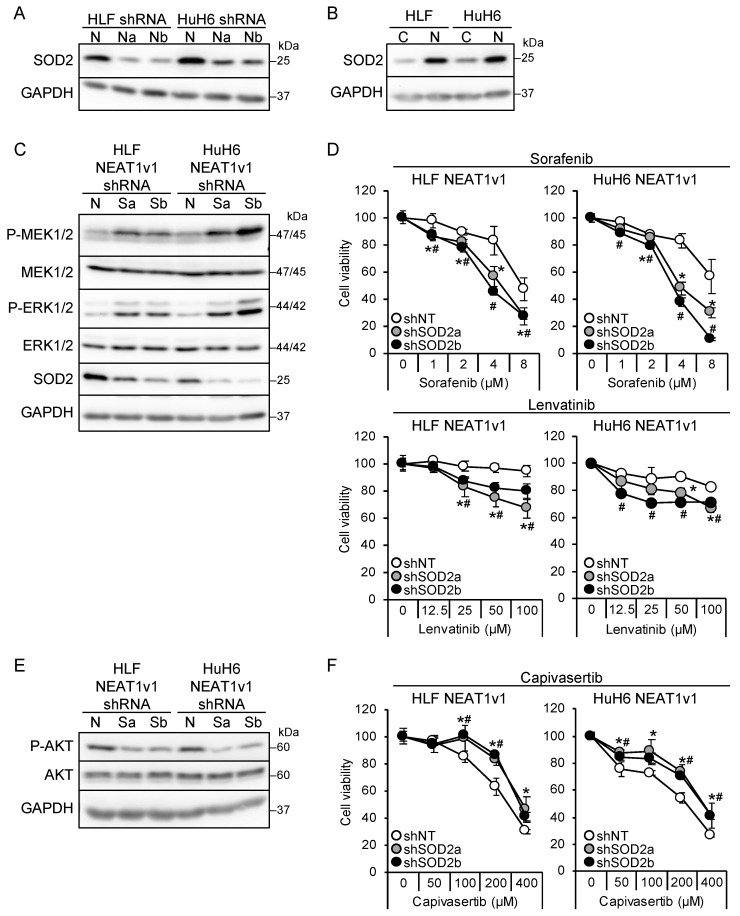
Figure 4.
NEAT1v1 regulates cell growth modality through SOD2. (A) Representative Western blot images for SOD2 expression in HLF and HuH6 cells transduced with adenoviruses expressing shNT (N), shNEAT1a (Na), or shNEAT1b (Nb) for 48 h. GAPDH is shown as an internal control. (B) Representative Western blot images for SOD2 expression in control (C) or NEAT1v1-overexpressing (V1) HLF and HuH6 cells. (C,E) Representative Western blot images for the indicated proteins in NEAT1v1-overexpressing cells transduced with adenoviruses expressing shNT (N) or SOD2-specific shRNAs [shSOD2a (Sa) and shSOD2b (Sb)] for 48 h. (D,F) Viabilities of cells treated with sorafenib (D), lenvatinib (D), or capivasertib (F) at the concentrations indicated in the figure for 48 h relative to cells treated with DMSO (100%). NEAT1v1-overexpressing cells were transduced with adenoviruses expressing shNT, shSOD2a, and shSOD2b 48 h before drug treatment. * p < 0.05 vs. shNT vs. shSOD2a; # p < 0.05 shNT vs. shSOD2b (Dunnett’s test; n = 4).

