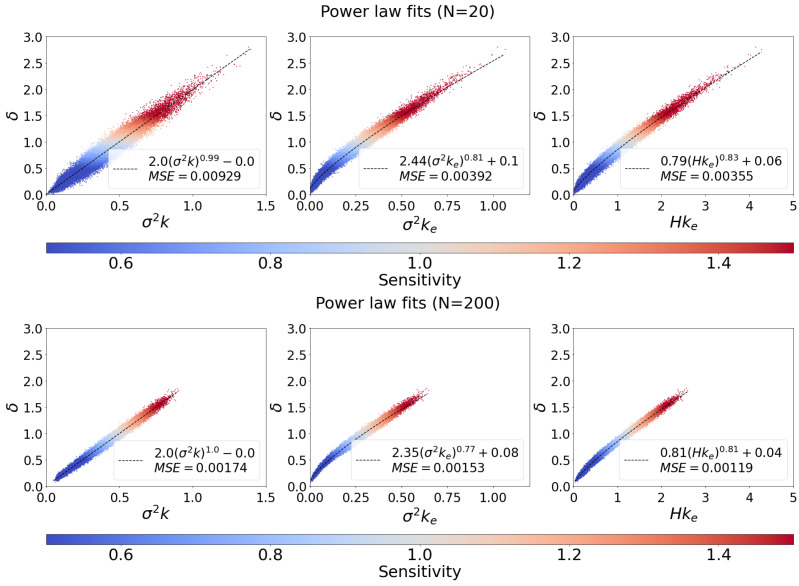
Figure 2.
Ability of each measure to predict the Derrida coefficient of heterogeneous random networks. Each point corresponds to a sampled network, and its color indicates the network’s sensitivity. The curves are obtained by fitting a power-law function of various measures to the Derrida coefficient, : to the (left), the traditional comparison, to (center), and to (right), our proposed measures. Plots for two sizes of networks (, top; , bottom) are presented here. Plots for and are available in the Supplemental Figure S3. Plots combine networks sampled from all considered P and parameter values; thus each plot depicts networks. An alternate curve fit is also investigated in the Supplemental Figure S2. All additional plots show qualitatively similar results to those captured in the images presented in this figure.

