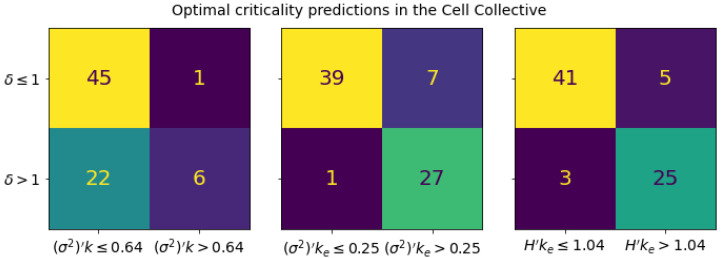
Figure 5.
Confusion matrices for the optimal critical boundaries in the Cell Collective computed using average node activation spread measures. Each boundary was optimized to maximize the Matthews correlation coefficient (MCC), the accuracy, and the Cohen kappa metric. Each matrix corresponds to a given threshold parameter that is evaluated to predict the dynamical regime. From left to right, these are , the traditional connectivity-spread product, , and , our proposed measures. The predicted regime is given by the horizontal labels, and the ground truth regime, as computed from the Derrida coefficient, is given by the vertical labels. In all cases, the obtained boundary simultaneously maximized all three performance metrics (see Supplemental Figure S11). From left to right, the MCCs are , , ; the accuracies are , , ; and the Cohen kappa scores are , , .

