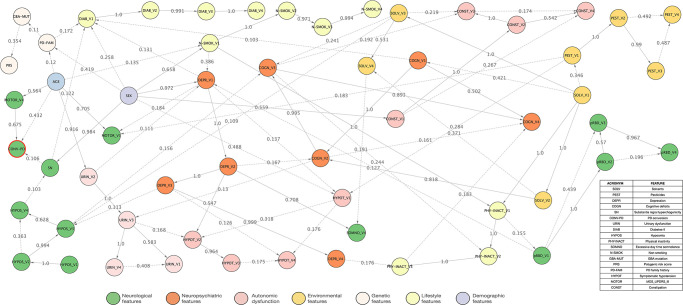
Fig 1. Interdependencies between different risk markers and prodromal markers of Parkinson’s Disease.
The depicted Bayesian network represents interdependencies between variables learned from prospective TREND data. Domains of marker nodes are indicated by circle color. The node of the “Conversion to PD” is indicated by a red circle outline. Numbers on edges indicate the level of statistical confidence (bootstrap probability), and dashed edge lines indicate confidences <0.5 while solid lines indicate a confidence ≥0.5. A higher value indicates a higher confidence in the existence of a connection. Nodes isolated from the rest of the network are not shown. V indicates the respective visit number.

