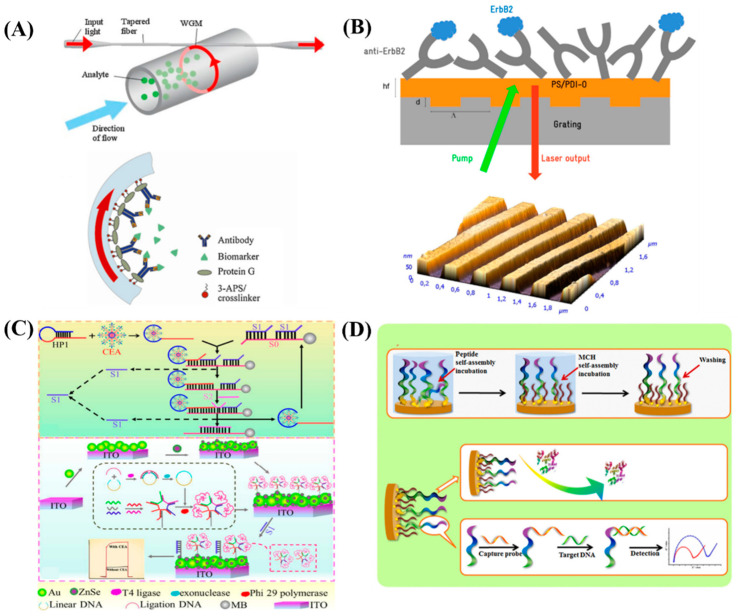
Figure 3.
(A) Schematic representation of the OFRR sensor. Re-used with permission from Ref. [25] (Copyright, 2010 Elsevier, reproduced with permission from Elsevier Ltd.). (B) Scheme of the DFB laser sensor. Re-used with permission from Ref. [26]. (Copyright, 2016 Elsevier, reproduced with permission from Elsevier Ltd.) (C) Schematic of the PEC biosensor for CEA determination. Re-used with permission from Ref. [27]. (Copyright, 2016 Elsevier, reproduced with permission from Elsevier Ltd.) and (D) Schematic illustration of Peptide SAM formation, fabrication and sensing procedures. Re-used with permission from Ref. [28]. (Copyright, 2017 Elsevier, reproduced with permission from Elsevier Ltd.).

