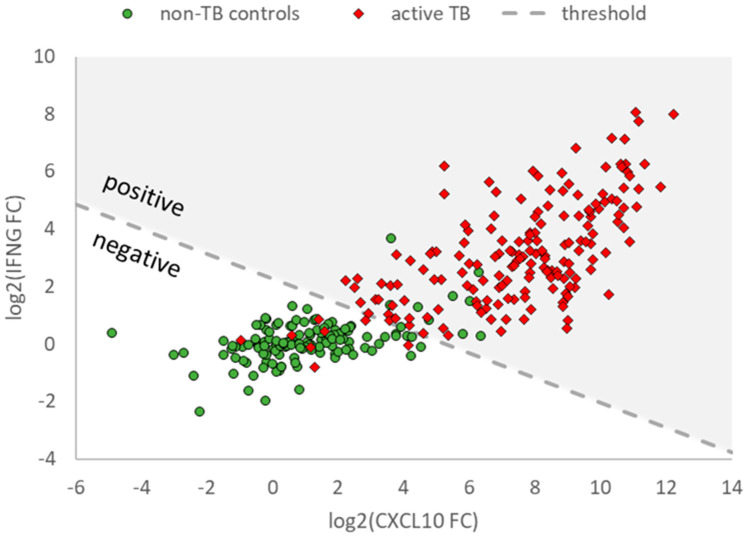
Figure 3.
IFNG and CXCL10 mRNA expression levels in samples from patients with active TB and uninfected study participants obtained with T-Track® TB. Scatter plot showing valid log2-transformed fold change (FC) values of IFNG and CXCL10 mRNA levels in samples from patients with active TB (red diamonds) and uninfected study participants (green circles). Only samples with valid results for both markers are shown (n = 176 active TB, n = 135 non-TB controls). The dashed line (classification threshold) classifies the samples into “positive” (upper right) and “negative” (lower left).

