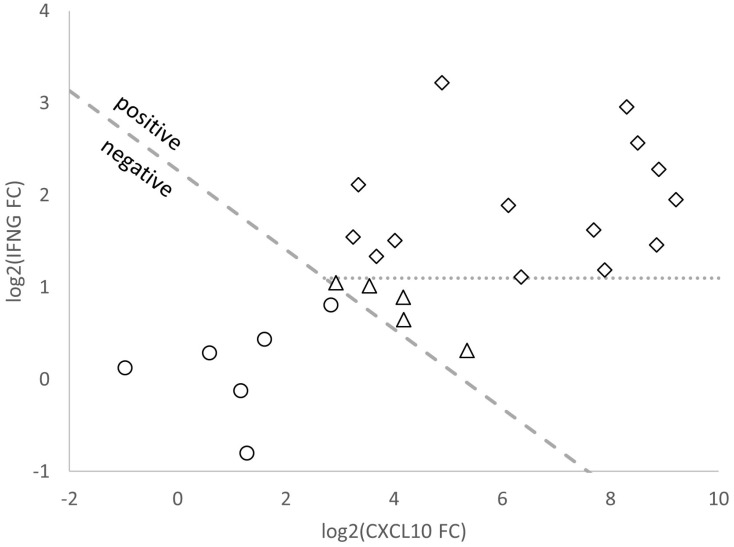
Figure 4.
Scatter plot of log2 fold change (FC) values of CXCL10 and IFNG mRNA expression generated by T-Track® TB from samples of 25 TB patients classified as false negative by QFT-Plus. Samples shown with white circles were also misclassified by T-Track® TB (rated as negative by both assays). Samples shown with diamonds and triangles were correctly classified based on log2-transformed FC values of IFNG and CXCL10 mRNA markers by T-Track® TB. Samples shown with diamonds above the dashed line were also classified as positive by the determination of the IFNG mRNA marker alone, as opposed to the samples shown as triangles below the dashed line. This indicates the benefit of combining IFNG and CXCL10 mRNA FC results in T-Track® TB to improve assay sensitivity.

