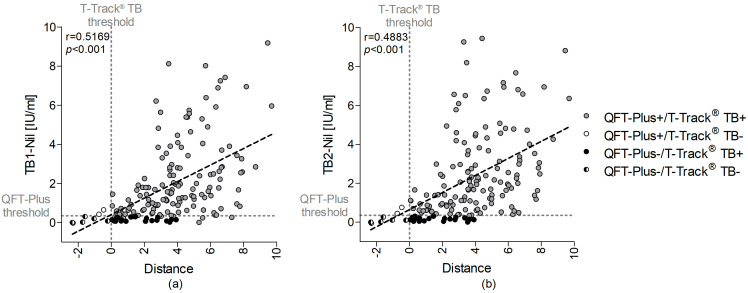
Figure 5.
Correlation analysis between QFT-Plus results for (a) TB1-Nil or (b) TB2-Nil (IU/mL) and T-Track® TB distance values for 164 donors with active TB. The 19 TB patients misclassified by QFT-Plus are shown as black circles, the 2 patients misclassified by T-Track® TB are depicted as white circles and the 6 patients falsely classified by both tests in black–white circles. TB patients correctly classified with both tests are depicted in grey. The vertical dashed line depicts the T-Track® TB classification threshold defining the T-Track® TB assay result (“positive” vs. “negative”), and the horizontal dashed line represents the QFT-Plus threshold. Regression analysis was performed by linear correlation. QFT-Plus+/−, positive/negative QuantiFERON®-TB Gold Plus test result; T-Track TB+/−, positive/negative T-Track® TB test result.

