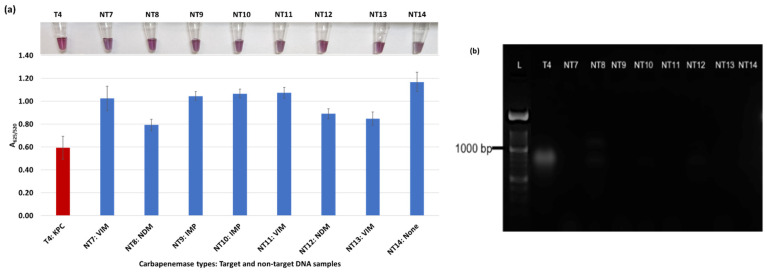
Figure 4.
Plasmonic biosensor and PCR results of E. cloacae samples: (a) the average absorbance ratio at 625 and 520 nm (A625/520) of the target (T) and non-target (NT) samples, with colorimetric results in tubes. Detected target samples are shown with red color bars, and non-target samples are shown with blue bars. (b) PCR amplification results of the same samples with a 1000 bp ladder.

