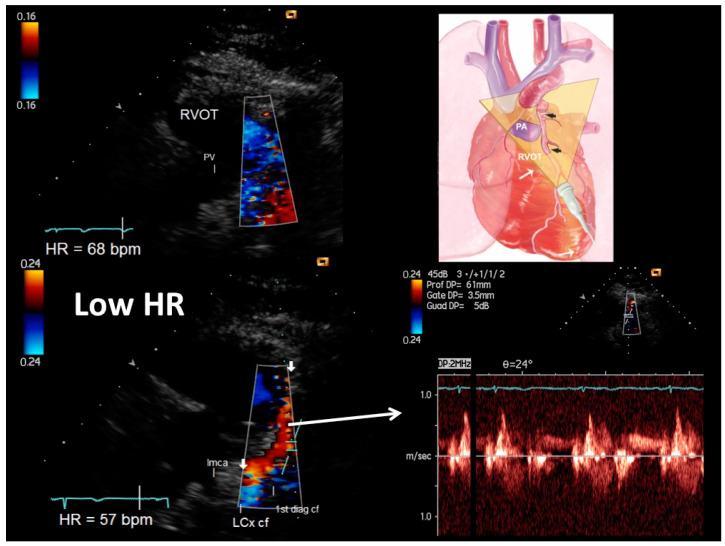
Figure 1.
An example of proximal–mid-LAD color flow (plane orientation at the top right corner) at higher HR (68 b/m) (upper right) and after HR reduction (57 b/m) (bottom right): at the baseline with higher HR no flow is detected; after HR lowering (<60 b/m), optimal color signal is recorded in the LAD so allowing color-guided pulsed-wave Doppler sampling of optimal quality (bottom right). Additionally, the first thin diagonal branch is depicted along with the origin of the left circumflex coronary artery whose flows are coded in blue since are away from the probe. The left main coronary artery (directed posteriorly) is evident in B-mode. LMCA = left main coronary artery; LCx cf = proximal left circumflex coronary artery color flow; 1st diagonal cf = first diagonal color flow; LMCA = left main coronary artery; RVOT = right ventricular outflow tract; pv = pulmonary valve.

