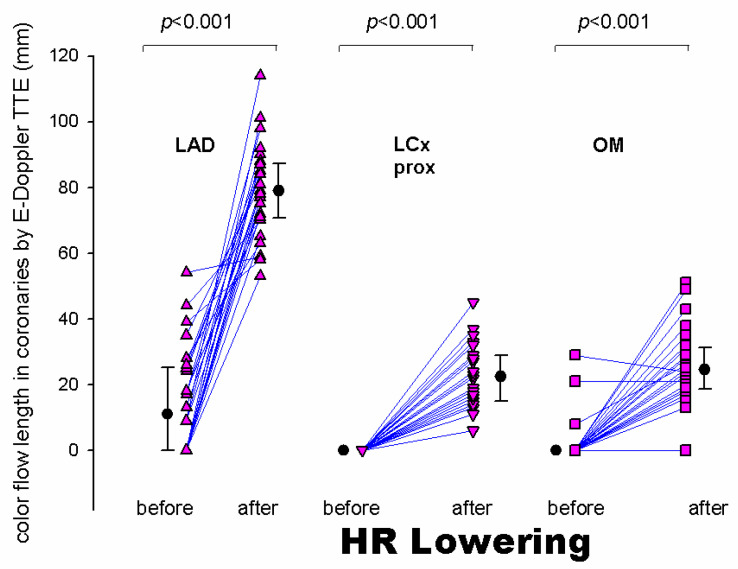
Figure 4.
Individual value bar graph (and median [IQR]) of the color flow length measured in the whole LAD (triangles vertex up), proximal LCx (triangles vertex down) and the Obtuse Marginal (squares) before and after HR lowering. The length of the artery explored by E-Doppler TTE in terms of color flow is enormously and significantly expanded after HR lowering. LAD = left anterior descending coronary artery; LCx = left circumflex coronary artery; prox = proximal; OM = obtuse marginal branch of the LCx; HR = heart rate; IQR = interquartile range.

