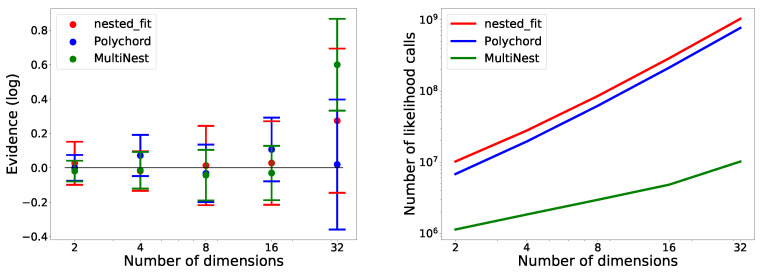
Figure 14.
Comparison of nested_fit, Polychord and MultiNest on the Gaussian (Section 4.1.1) in two, four, eight, sixteen and thirty-two dimensions. Eight runs were performed for each case. On the left, the computed values are represented. The expected value is represented by the black line: 0. On the right, the correspondent number of likelihood calls are reported.

