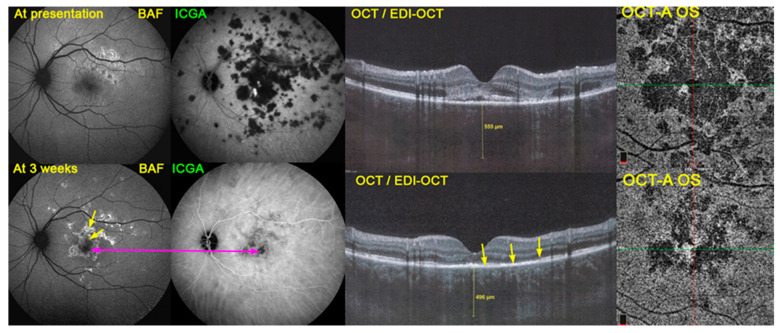
Figure 1.
Multimodal imaging in APMPPE combining BAF, ICGA and OCT/EDI-OCT. This combination of invasive (ICGA) and non-invasive methods (BAF and OCT/EDI-OCT) gives a precise appraisal of the condition. BAF at presentation (top left) still showed minimal changes despite the extensive choriocapillary non-perfusion shown on ICGA (top middle), because the overlying RPE and outer retina were still at an edematous stage, as shown on OCT/EDI-OCT (top right). Three weeks later, after the partial re-perfusion seen on ICGA (bottom middle), the damaged areas were visible on BAF (bottom left). In the center, there was hypoautofluorescence corresponding to remaining non-perfusion on ICGA (crimson arrow). The bright hyperautofluorescent areas correspond to both suffering RPE cells with accumulated fluorophores and to the loss of photoreceptor outer segments, as shown on OCT/EDI-OCT (bottom right) (yellow arrows). OCT-A did not yield additional information, showing the same non-perfusion areas as seen on ICGA (choriocapillary drop out), limited to the central macular area, but was useful in the follow-up of these central damaged areas (also see Figure 3). (Far-right) OCT-A images at presentation (top right) and after 3 weeks (bottom right).

