
Figure 4.
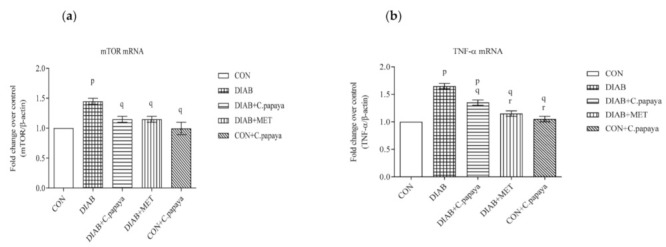

(a) Effect of C. papaya in control and treated T2DM rats, in terms of the levels of mTOR mRNA expression; (b) Effect of C. papaya in control and treated T2DM rats, in terms of the levels of IL-1β mRNA expression; (c) Effect of C. papaya in control and treated T2DM rats, in terms of the levels of IL-6 mRNA expression; (d) Effect of C. papaya in control and treated T2DM rats, in terms of the levels of TNF-α mRNA expression; (e) Effect of C. papaya in control and treated T2DM rats, in terms of the levels of IKKβ mRNA expression; Each bar depicts the mean ± SEM of eight rats, with p < 0.05 designating statistically significant differences between the groups as follows: p—control; q—diabetes; r—T2DM rats + C. papaya.