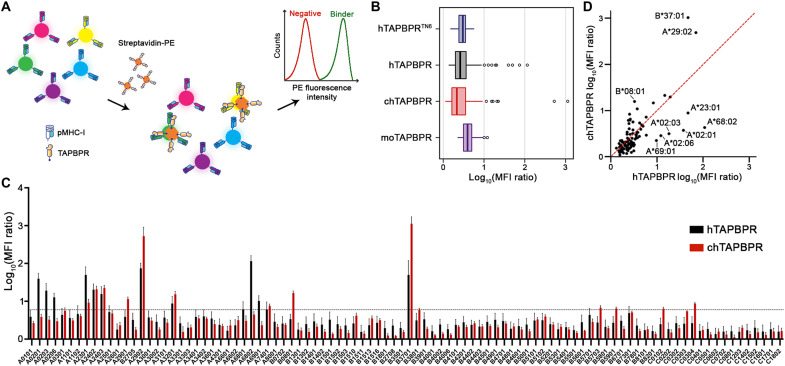
Fig. 2. TAPBPR orthologs demonstrate distinct HLA-binding profiles using SABs.
(A) Schematic representation of the SAB assay used to measure the levels of binding to individual HLA-I allotypes by streptavidin–phycoerythrin (PE)–conjugated TAPBPR orthologs. SABs are color-coded and are decorated with different HLA-I allotypes. The SABs were incubated with 7 μM tetramerized TAPBPR for 1 hour at room temperature (RT). (B) Box plot showing the distribution of the TAPBPR MFI ratios for the 96 HLA-I allotypes. hTAPBPRTN6 was used to determine interactions between TAPBPR orthologs and MHC-I molecules. The boundary of the box closest to zero indicates the 25th percentile, the line within the box marks the median, and the boundary of the box farthest from zero indicates the 75th percentile. Whiskers above and below the box indicate the 10th and 90th percentiles. The points above the whiskers indicate outliers outside the 90th percentile. (C) Bar graph showing the levels of hTAPBPR and chTAPBPR binding to the SABs. Incubation with the W6/32 antibody before tetramer staining was used to control for the nonspecific background binding, and the MFI ratio of TAPBPR/control was determined. A cutoff of log10 of 5.97 (0.77) was set to determine an interaction as significant, calculated from the mean MFI ratio of hTAPBPRTN6 + 3σ. Plotted data are means ± σ from three independent experiments. (D) Correlation of hTAPBPR and chTAPBPR log10 (MFI ratio) plotted in (C). The dashed red line represents a conceptual 1:1 correlation (no difference between orthologs).

