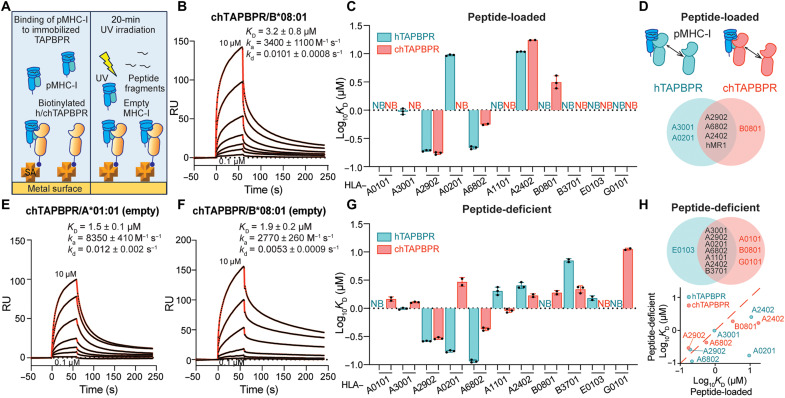
Fig. 3. TAPBPR orthologs recognize peptide-deficient HLA molecules with a broad allelic specificity in vitro.
(A) Schematic diagram showing TAPBPR orthologs immobilized on the SPR sensor chip. Different photolabile pHLA molecules at various concentrations with or without UV irradiation flow over the surface. (B) Representative sensorgram of HLA-B*08:01/FLRGRAJGL flowed over a streptavidin chip coupled with chTAPBPR-biotin. (C) Log-scale comparison of KD values for chTAPBPR or hTAPBPR interacting with HLA allotypes as indicated. (D) Schematic summary of pHLA molecules interacting with hTAPBPR or chTAPBPR in light blue or red, respectively. Allotypes that bind to hTAPBPR, chTAPBPR, or both are colored in blue, red, and black. (E and F) Representative sensorgrams of UV-irradiated HLA-A*01:01 (E) and HLA-B*08:01 (F). (G) Log-scale comparison of KD values for chTAPBPR or hTAPBPR interacting with peptide-deficient HLA allotypes as indicated. (H) Schematic summary of peptide-deficient HLA molecules interacting with hTAPBPR or chTAPBPR in light blue or red, respectively. Allotypes that bind to hTAPBPR, chTAPBPR, or both are colored in blue, red, and black. Correlation of peptide-loaded and -deficient HLA binding to hTAPBPR and chTAPBPR log10 KD plotted in (C) and (D). The dashed red line represents a conceptual 1:1 correlation (no difference between peptide-loaded and -deficient molecules). KD, equilibrium constant; ka, association rate constant; kd, dissociation rate constant; RU, resonance units. The concentrations of analyte for the top and the bottom sensorgrams are noted. Fits from the kinetic analysis are shown with red lines. Results of at least two technical replicates (means ± σ) are plotted.

