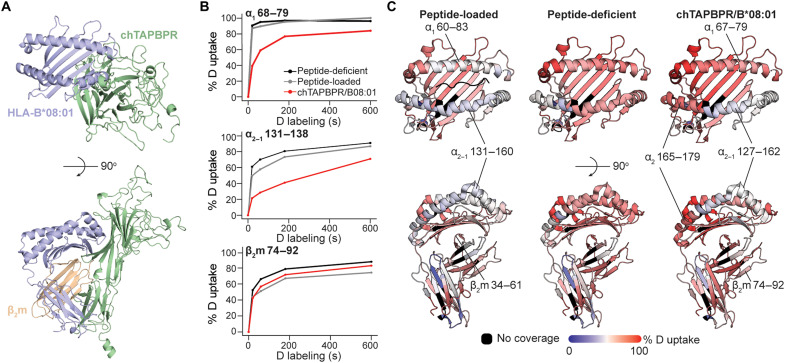
Fig. 5. The chTAPBPR ortholog stabilizes HLA-B*08:01 in a receptive conformation by recognizing conserved epitopes on MHC-I relative to hTAPBPR.
(A) A structural model of the HLA-B*08:01/chTAPBPR complex generated by RosettaCM (72) (BAKER-ROBETTA server). (B) The percent deuterium uptake resolved to individual peptide segments showing α1 68 to 79, α2–1 131 to 138, and β2m 74 to 92 is plotted for each exposure time (0, 20, 60, 180, and 600 s) and protein states. The plots reveal the local HDX profiles of HLA-B*08:01 for the states of peptide-deficient (black; UV irradiation for 40 min at 4°C), peptide-loaded (gray; refolded with FLRGRAJGL), and chTAPBPR-bound complex (red; UV irradiated for 40 min at RT in the presence of excess chTAPBPR, followed by SEC purification of the complex peak). (C) The percent deuterium uptake resolved to individual residues upon 60-s deuterium labeling for peptide-loaded (left), peptide-deficient (middle), and chTAPBPR-bound complex (right) states is mapped onto the HLA-B*08:01 crystal structure (58) (PDB ID: 4QRU) for visualization. Red- and blue-colored regions indicate segments containing peptides with 100% ΔHDX (red—more deuteration) or 0% ΔHDX (blue—less deuteration), respectively; black indicates regions where peptides were not obtained for peptide-loaded, peptide-deficient, and chTAPBPR-bound protein states.

