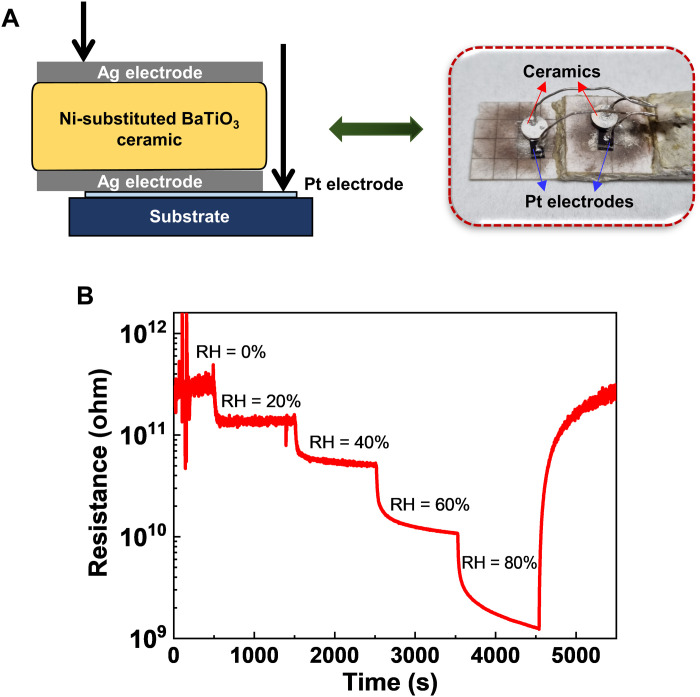
Fig. 6. Sensing performance experiments.
(A) Schematic diagram of a humidity sensing experiment. (B) Resistive responses of Ni-substituted BaTiO3 ceramics to the change in RH. A stepwise decrease in the electrical resistance of the sensors was observed with the increasing humidity levels. The electrical resistance of ceramics gradually recovered to the initial value when the RH changed from 80 to 0% again.

