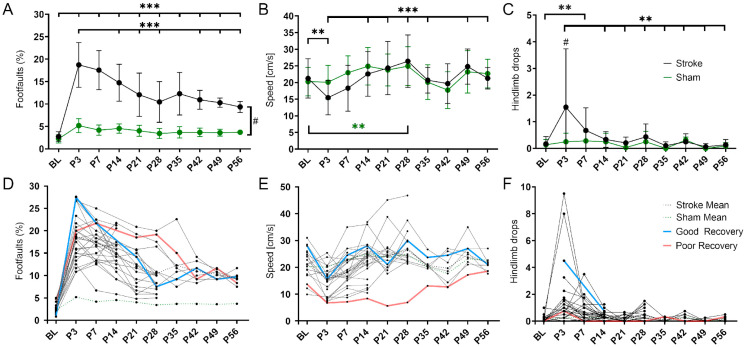
Figure 1.
Variability in spontaneous functional recovery after cortical stroke. (A) The percentage of foot faults per step on the grid walk test was significantly increased in the stroke mice compared to the sham mice (p < 0.001) at all time points post-stroke (P3-56). Over time, the stroke mice made significantly fewer foot faults than on day 3 (P3; p < 0.001 except P7 and P35. (B) The speed achieved on the rotating beam was significantly slower in the stroke mice at P3 than BL and did not reach BL levels later. Over time, the stroke mice were significantly faster compared to day 3 (P3; p < 0.01 except P14 and P42). The speed of the sham mice was not decreased but increased significantly between BL and P28 (p < 0.01). (C) The stroke mice made significantly more hindlimb drops on the rotating beam only at P7 compared to BL (p < 0.001). Over time, the stroke mice made significantly fewer hindlimb drops than on day 3 (P3; p < 0.01 except P7). The sham mice did not make more or fewer hindlimb drops after stroke. (D–F) The same data but shown here as spaghetti plots: mean stroke data (blue, dotted), mean sham data (red, dotted), and single stroke data (black). Light blue and light red indicate an example of good and poor recovery mice, respectively. Significant differences between time points with p < 0.01 (**), p < 0.001 (***) and groups with p < 0.05 (#) were based on the mixed-effects analysis with post-hoc Dunnett’s multiple comparisons test. Stroke n = 30; sham n = 14. The data are shown as mean ± SD (A–C) or mean and single values (D–F).

