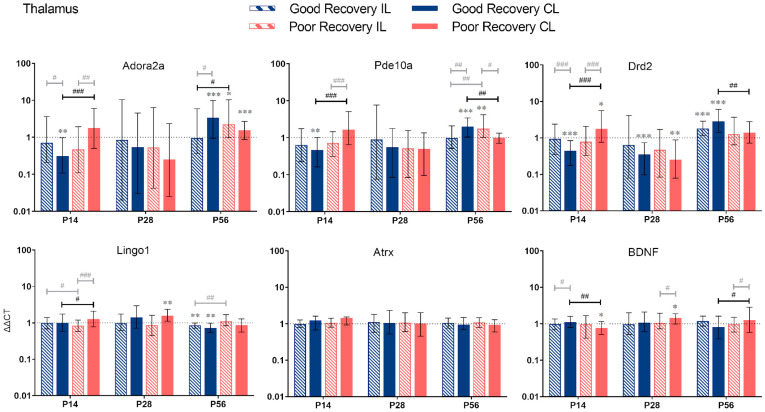
Figure 6.
Adora2a, Pde10a, Drd2, Lingo1, Atrx, and BDNF gene expression in the thalamus (TH) at 14, 28, and 56 days post-stroke. Data are shown as ΔΔCt (mean ± SE), compared to gene expression in sham mice and normalization to expression of GAPDH as the reference gene, which was set at 1 (dotted line). Significant difference from sham shown as p < 0.05 (*), p < 0.01 (**), p < 0.001 (***). Significant differences between hemispheres and good/poor recovery, respectively, shown as p < 0.05 (#), p < 0.01 (##), p < 0.001 (###). The black lines indicate a significant comparison between contralesional good and poor. Data, expression, and significance calculated by REST software. P14: n = 5 good, 4 poor, 5 sham; P28: 3, 2, 3; P56: 4, 3, 5.

