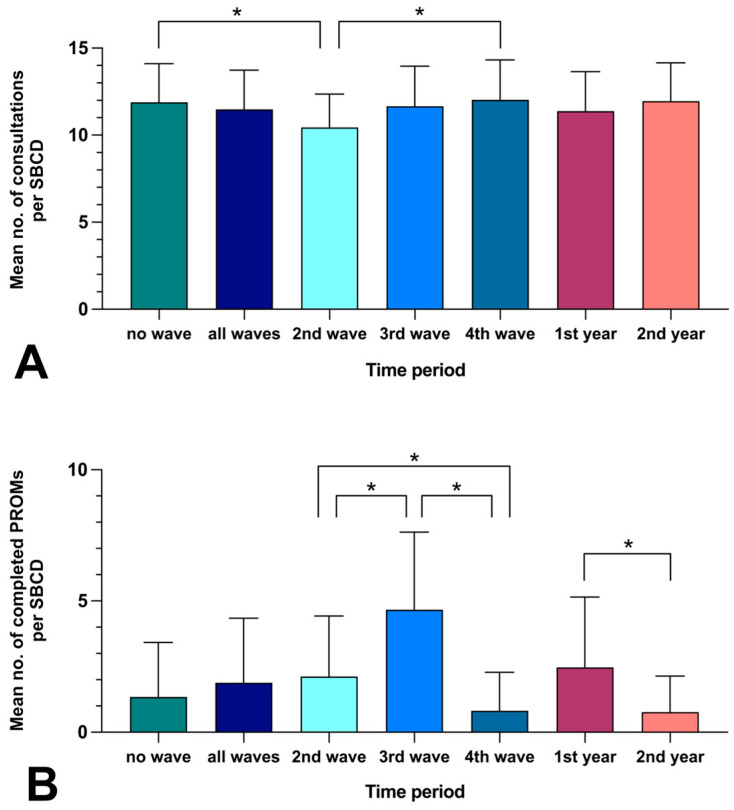
Figure 2.
Analysis of the conduction of PROMs in relation to the COVID-19 pandemic. no. = number, * = statistically significant difference (p < 0.05), (A,B): Comparison of the mean number (with standard deviation) of (A) consultations per “skull base consultation day” (SBCD) or of (B) completed PROMs per SBCD (in relation to the total of 96 SBCDs), illustrated for the 13 months during COVID-19 waves (“all waves” or subdivided into “second wave” (2nd wave), “third wave” (3rd wave), and “fourth wave” (4th wave)) and the 11 months beyond COVID-19 waves (“no wave”), and illustrated for the “first year” (1st year) and “second year “ (2nd year) after implementation of PROMs.

