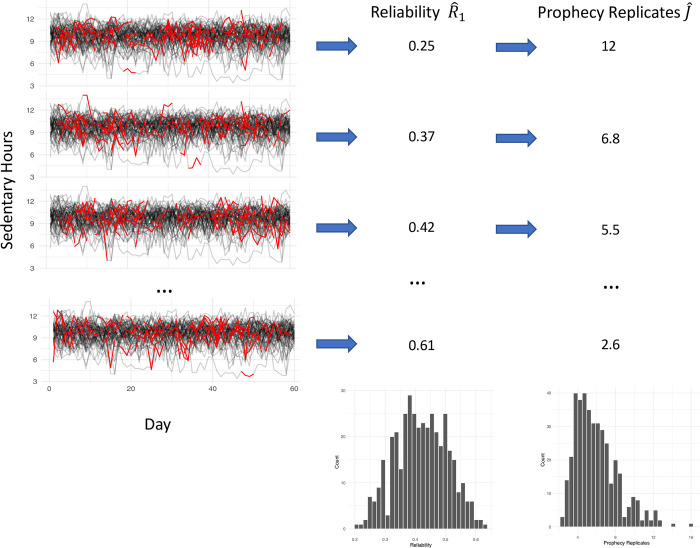
Fig 1. Framework for creating sampled datasets.
Each row represents a single sampled dataset. The left column contains all of the observed activity trajectories in the motivating data, with the red segments representing the selection of days J which were selected for a given sample. The second column shows the estimated reliability based on the previous selection of days. The final column shows the subsequent prophecy estimate of the number of replicates required to achieve a reliability of 0.8. The histograms at the bottom of the second and third columns represent the distributions of and across all 200 samples generated in this way.

