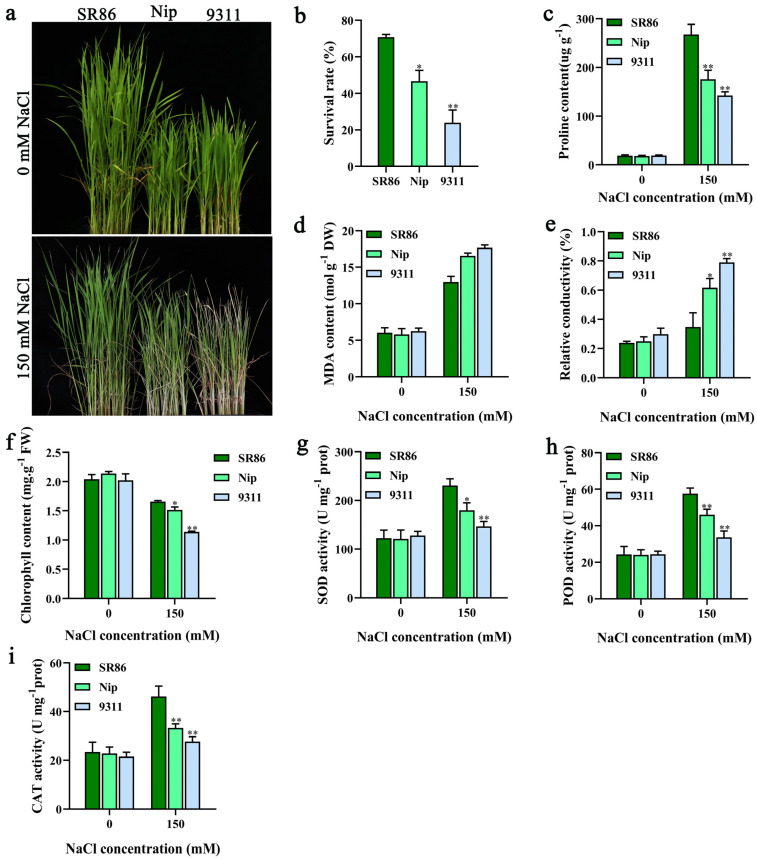
Figure 1.
The phenotypic comparison of SR86, Nip, and 9311 plants under salt stress conditions. (a−i) Phenotype (a), survival rate (b), proline content (c), MDA content (d), relative electrical conductivity (e), chlorophyll content (f), SOD activity (g), POD activity (h), and CAT activity (i) of SR86, Nip, and 9311 plants after treatment with 150 mM NaCl solution for 5 d. The data represent the mean ± SD of three independent replicates. Asterisks indicate statistically significant differences (* p < 0.05, ** p < 0.01).

