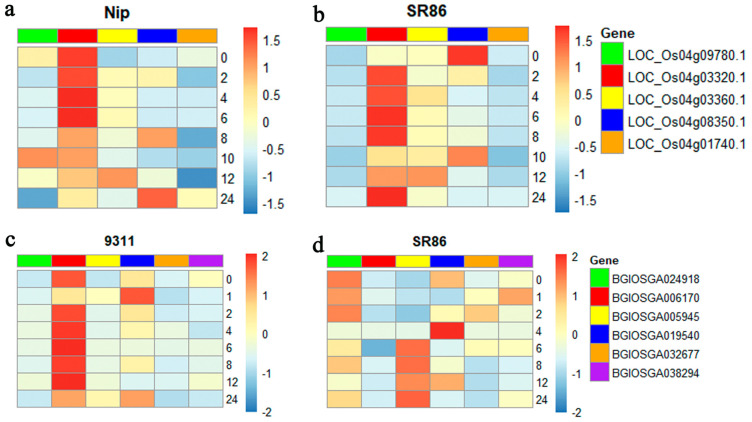
Figure 7.
The expression validation of candidate genes in SR86, Nip, and 9311 plants under normal (0 mM NaCl) and salt stress (150 mM NaCl) conditions by RT−qPCR. (a) Expression of candidate genes in Nip. (b) Expression of candidate genes in SR86. (c) Expression of candidate genes in 9311. (d) Expression of candidate genes in SR86. Plants were treated with 150 mM NaCl for 24 h. The abscissa indicates the salt concentration and the ordinate shows the relative gene expression level, which was calculated using the 2−ΔΔCT method. Data represent the mean ± SD of three biological replicates.

