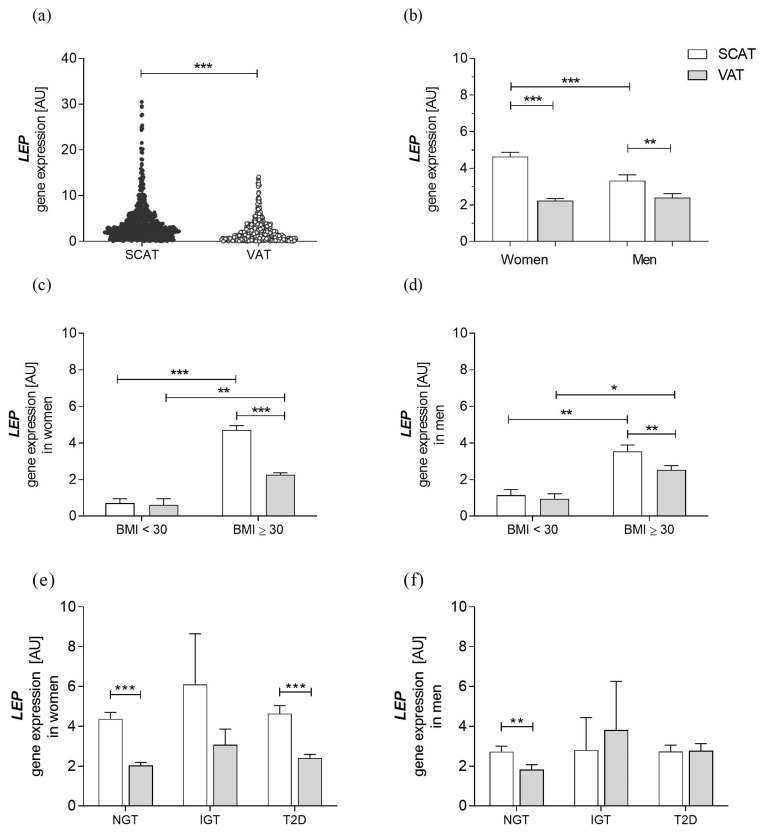
Figure 1.
Characterization of LEP gene expression. LEP gene expression in (a) the entire cohort (N = 585) in subcutaneous (SCAT) and visceral (VAT) adipose tissue, (b) SCAT and VAT separated by sex (N = 429 in women, n = 156 in men), (c,d) obese patients (BMI ≥ 30 kg/m2; N = 420 in women, N = 143 in men) in comparison to the control group (normal weight and overweight individuals with BMI < 30 kg/m2; N = 6 in women, N = 14 in men) in SCAT and VAT respectively and (e) individuals with different degrees of glucose intolerance (for NGT N = 190 in women, N = 73 in men; for IGT N = 10 in women, N = 3 in men; for T2D N =157 in women, N = 68 in men). Group comparing analysis was performed on ln-transformed data by two-sided t-test or Welch’s test in case of unequal variances for (a–d) and by ANOVA with posthoc Bonferroni test for (e,f). Data are shown as mean ± SEM. * p < 0.05; ** p < 0.01; *** p < 0.001. NGT: normal glucose tolerance; IGT: impaired glucose tolerance; T2D: Type 2 Diabetes mellitus.

