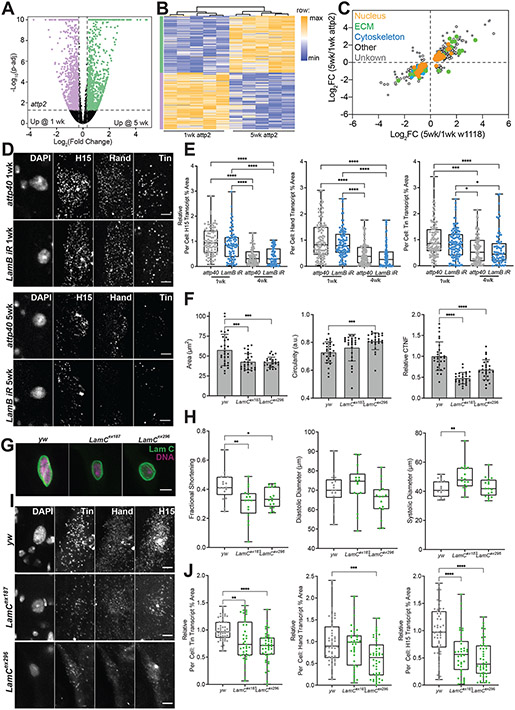
Extended Data Fig. 4. Validation of transgenic fly background, effects of LamB on myogenic transcription factor expression, and LamC heterozygous flies.
(A) Volcano plot and (B) heat map of bulk RNA-seq from surgically dissected attp2 heart tubes. Fold change represents 5-week attp2 fly hearts normalized to 1-week old hearts and p-adj was computed from quintuplicate. 1,998 differentially expressed genes (DEGs) were assessed from cutoffs of −0.32 > log2(FC) > 0.32 (or −1.25 > FC > 1.25) (dashed lines) from comparisons of 15 fly hearts per replicate; DEGs increasing and decreasing with age are shown in green and purple, respectively. Heatmap columns were hierarchically clustered using Euclidean distance and linkage shown by the dendrogram. Heat maps are normalized within each gene/row. (C) 635 of 688 genes were co-regulated DEGs (92.3%) in the w1118 and attp2 control fly hearts, and plotted based on their fold change with age. DEGs were annotated based on their ontological categorization as nuclear (orange), extracellular matrix (ECM; green), or cytoskeletal (blue). A subset of DEGs either did not fit those categories (black/white) or lacked a known ontology (gray). Only 7.7% of all DEGs were dysregulated. (D) Representative images of attp40 control and LamB RNAi flies at 1 and 4 weeks showing H15, Hand and Tin transcription factor mRNA and DAPI. Scale bar is 5 μm. (E) Quantification of the per cell percentage area for each transcript in attp40 control and LamB RNAi flies at 1 and 4 weeks. For H15, n = 93, 87, 85, and 71 cells, left to right. For Hand, n = 111, 96, 105, and 76 cells, left to right. For Tin, n = 105, 118, 102, and 76 cells, left to right. (F) Quantification of cardiomyocyte nuclear area, circularity and LamC corrected total nuclear fluorescence for 1 week aged female control yw/w1118 and heterozygous LamC excision mutants yw/w1118;LamCex187/+ and yw/w1118;LamC296/+ fly hearts and their representative images in (G) showing staining for LamC (green) and DNA (Magenta), scale bare = 5μm. For (F), n = 29, 26, 25 (CM nuclei, left to right) (H) Quantification of heart parameters: fractional shortening, diastolic diameter and systolic diameter for background control and heterozygous LamC excision mutants. n = 17, 16, 16 (heart tubes, left to right) (I) Representative images of Hand, H15 and Tin mRNA in heterozygous LamC excision mutants, presented with quantification of per cell percentage area for each transcript in (J). n = 52, 39, 46 (CM nuclei, left to right). *p<0.05, **p<10−2, ***p<10−3, and ****p<10−4 by one-way ANOVA with Tukey multiple comparisons test. Box plots in (E, H, J) refer to min to max, with median and 25th and 75th interquartile range and error bars in (F) refer to mean +/− SD.

