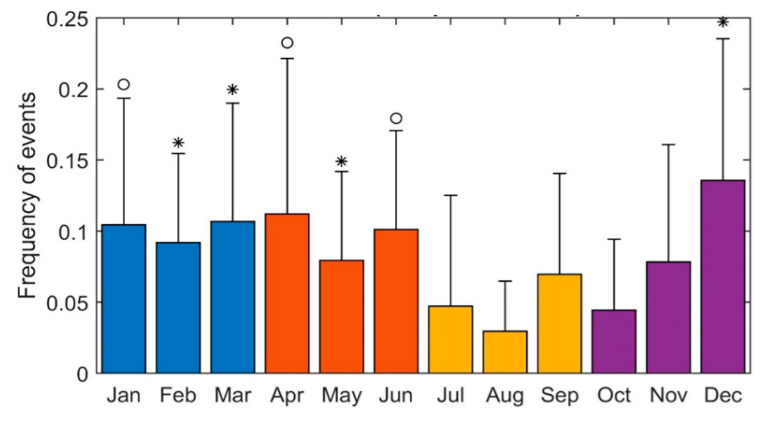
Figure 4.
Distribution of event frequency for each month. The lowest event frequency was registered in August. Pairwise comparison shows that the event frequency registered in August was significantly lower than the event frequency in December, February, March and May (* indicates p < 0.05, ”◦” indicates 0.1 < p < 0.05, Wilcoxon ranksum test).

