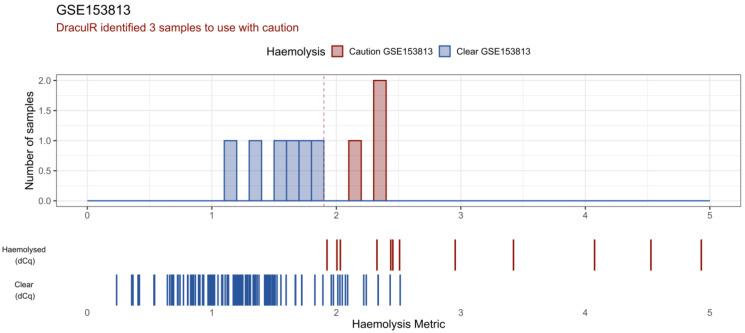
Figure 3.
DraculR uses public data to illustrate the potential for unidentified haemolysis that could confound biomarker analysis. Here, miRNA expression data from NCBI GEO (GSE153813) was analysed and visualised. This screenshot shows the main DraculR visualisation of the data. The histogram represents the queried dataset where three samples were flagged to be used with caution (red) and six were classified as clear of haemolysis (blue). As a reference, the barcode-style plots below the histogram display the Haemolysis Metric values of samples from an example dataset validated using the ΔCq method (Smith et al.); red for those identified as haemolysed (ΔCq > 7), blue for those classified as ‘Clear’ of haemolysis (ΔCq < 7).

