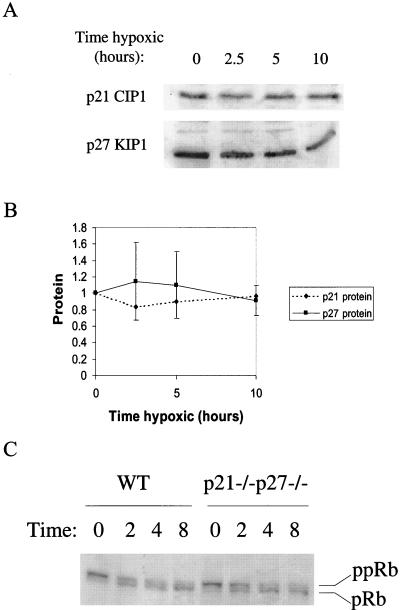
FIG. 4.
(A) Representative Western blots of p21 and p27 in hypoxic cell extracts. (B) Composite Western blot data from multiple experiments. Blots were scanned on a Storm Imager and analyzed with ImageQuant; the numbers given are ratios relative to the control. (C) Western blot of pRb in hypoxia-treated cells; the higher mobility band represents unphosphorylated or hypophosphorylated pRb (pRb) while the lower mobility band contains hyperphosphorylated pRb (ppRb). WT, wild type.

