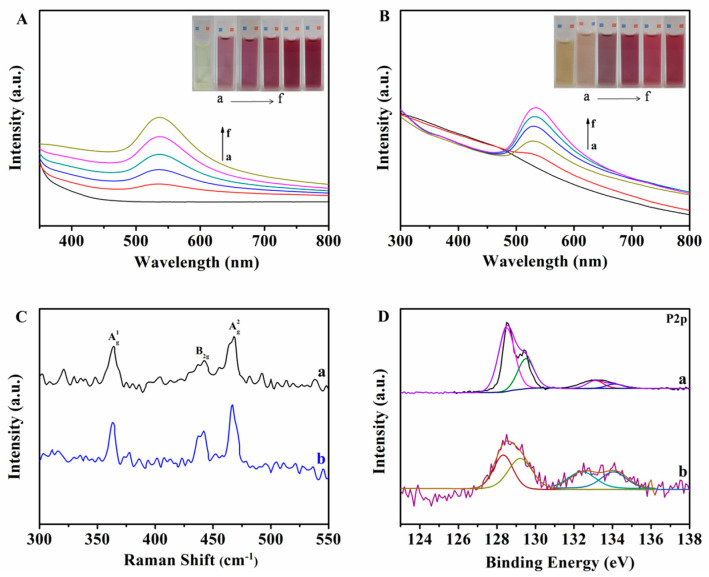
Figure 3.
(A) UV–Vis spectrum of HAuCl4 mixed with BPNS at different amounts (from a to f: 0, 0.2, 0.4, 0.6, 0.8, 1 mg/mL). (B) UV–Vis spectrum of HAuCl4 added to BPNS for different times (from a to f: 0, 15, 30, 40, 50, 60 min). (C) Raman spectra of BPNS (curve a) and AuNPs–BPNS (curve b). (D) High-resolution XPS spectra of the P2p core level for BPNS (curve a) and AuNPs–BPNS (curve b).

