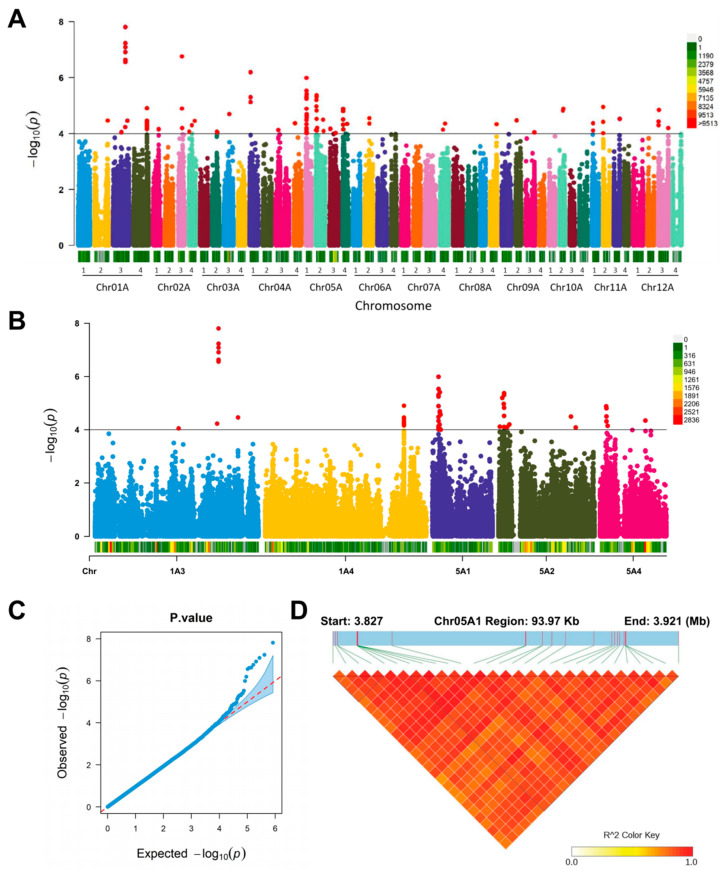
Figure 3.
The genome-wide association analysis of plant height. (A,B) The Manhattan plot of the plant height. Horizontal axis displays the chromosome: 0–9513 legend insert indicates the SNP density (A) and 0–2836 legend insert indicates the SNP density (B); (C) Quantile–quantile plot for the plant height; (D) the LD heat map of the plant height associated region on Chr05A1; Red and white color legend insert indicate high and low degree of linkage disequilibrium, respectively.

