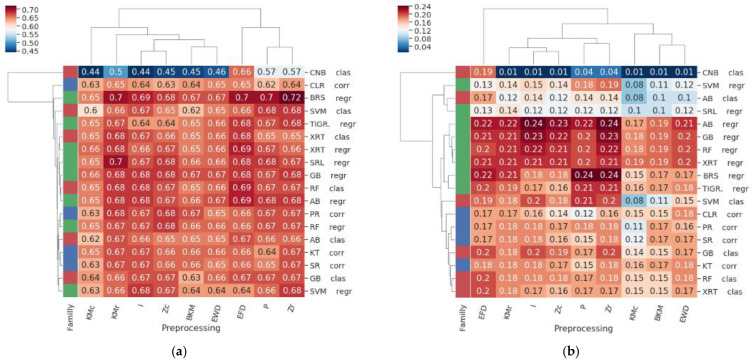
Figure 3.
Cluster maps representing the (a) AUROC and (b) AUPR values for each combination of inference methods (rows) and preprocessing technique (columns); notice that column I represents the identity (i.e., no preprocessing technique applied). The family of each method is reported in colors in the left column: regression in green, classification in red, and correlation/MI in blue. Preprocessing techniques that ensure that genes exhibit comparable levels of expression (i.e., row z-score, EFD, and row K-means) led to better performances on average.

