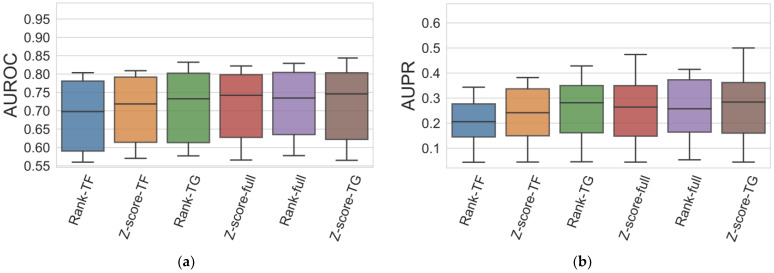
Figure 5.
Boxplots representing the average (a) AUROC and (b) AUPR obtained by the SVM•BRS•Ens ensembles, with different integration schemes, on all DREAM5 datasets. The integration schemes are arranged in ascending order based on their average AUROC and AUPR scores. All integration schemes had suitable results, but rank-TF and Z-score-TF tended to exhibited lower results compared to Z-score-TG, rank-full, Z-score-full, and Rank-TG. Therefore, it is suggested to use these latter integration schemes.

